CT Wu

Software Architect · Backend · Data Engineering

Apache Paimon is a new data lakehouse format that focuses on solving the challenges of streaming scenarios, but also supports batch processing. Overall, Paimon has the potential to replace the existing Iceberg as the new standard for data lakehousing.

Why Iceberg and not the other two (Hudi and Delta Lake)?

Iceberg is the most widely supported by various open-source engines, including pure query engines (e.g., Trino), New SQL databases (e.g., StarRocks, Doris), and streaming frameworks (e.g., Flink, Spark), all of which support Iceberg.

However, Iceberg faces several problems in streaming scenarios, the most serious one is the fragmentation of small files. Queries in data lakehouses rely heavily on file reads, and if a query has to scan many files at once, it will of course perform poorly.

To address this issue, an external orchestrator is required to regularly merge files. Paimon is designed with a built-in merge mechanism, and many other optimizations for mass writes, making it more adaptable to streaming scenarios.

Experiment environment

In order to learn more about Iceberg, I have set up two experimental environments.

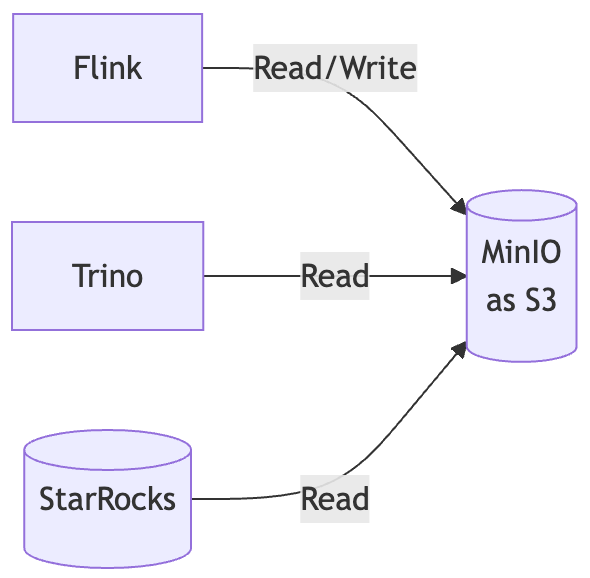
This time I also built a playground for Paimon, which also includes Trino and Flink.

In addition, StarRocks was also put in as a representative of New SQL.

Because neither Trino nor StarRocks support streaming writes at this stage, Paimon’s writes come from Flink.

How to use

NOTE: Since some of the links to the official Paimon files are not working, I’ve put the files into this repo. However, some of the files are huge, so I put them in via LFS, so be sure to install git-lfs.

Trino driver is in paimon-trino-427-0.8-20241112.000605-197-plugin.tar.gz.

1
tar -zxvf paimon-trino-427-0.8-20241112.000605-197-plugin.tar.gz

Then it will run normally with docker compose up -d.

1
docker compose up -d

Let’s start by connecting to Flink SQL.

1
2
docker compose exec flink-jobmanager ./bin/sql-client.sh  
./bin/sql-client.sh

To write data using Flink we first need to create the correct catalog.

1
2
3
4
5
6
7
8
CREATE CATALOG my_catalog WITH (  
'type' = 'paimon',
'warehouse' = 's3://warehouse/flink',
's3.endpoint' = 'http://storage:9000',
's3.access-key' = 'admin',
's3.secret-key' = 'password',
's3.path.style.access' = 'true'
);

As shown in the above commands, we’re using the MinIO as an S3 to store the Paimon.

The next step in creating the table and writing the data is quite simple, just run the commands according to the official documentat.

1
2
3
4
5
6
7
8
9
10
11
12
13
14
15
16
17
18
USE CATALOG my_catalog;  

-- create a word count table
CREATE TABLE word_count (
word STRING PRIMARY KEY NOT ENFORCED,
cnt BIGINT
);
-- create a word data generator table
CREATE TEMPORARY TABLE word_table (
word STRING
) WITH (
'connector' = 'datagen',
'fields.word.length' = '1'
);
-- paimon requires checkpoint interval in streaming mode
SET 'execution.checkpointing.interval' = '10 s';
-- write streaming data to dynamic table
INSERT INTO word_count SELECT word, COUNT(*) FROM word_table GROUP BY word;

Then we actually read it and see the result of what we’ve written.

1
2
3
4
5
6
7
-- use tableau result mode  
SET 'sql-client.execution.result-mode' = 'tableau';
-- switch to batch mode
RESET 'execution.checkpointing.interval';
SET 'execution.runtime-mode' = 'batch';
-- olap query the table
SELECT * FROM word_count;

Trino

Let’s go to Trino’s cli first.

1
docker compose exec trino trino

Trino’s paimon catalog is already set up, but I didn’t add a new schema but just used the default one.

So we can query the Flink write result directly.

1
SELECT * FROM paimon.default.word_count;

We should see something similar to the Flink query.

StarRocks

This is an extra, just to show how much attention Paimon is getting now that many New SQL databases are starting to support it.

Prepare a mysql client locally to connect to StarRocks.

1
mysql -P 9030 -h 127.0.0.1 -u root --prompt="StarRocks > "

We still need to create a catalog.

1
2
3
4
5
6
7
8
9
10
11
CREATE EXTERNAL CATALOG paimon_catalog_flink  
PROPERTIES
(
"type" = "paimon",
"paimon.catalog.type" = "filesystem",
"paimon.catalog.warehouse" = "s3://warehouse/flink",
"aws.s3.enable_path_style_access" = "true",
"aws.s3.endpoint" = "http://storage:9000",
"aws.s3.access_key" = "admin",
"aws.s3.secret_key" = "password"
);

The mysql client should not support Trino’s table locator format: <catalog>. <schema>. <table>, so we have to switch to the db before we can query.

1
2
USE paimon_catalog_flink.default;  
SELECT * FROM word_count;

The results here will be similar to the above.

Conclusion

Although Paimon supports many kinds of metastore as follows.

  • filesystem
  • hive metastore
  • jdbc

For the sake of simplicity, I didn’t use extra components, so I only use S3 aka filesystem as metastore. Although the function is fine, according to the official document, using S3 as warehouse needs to be paired with Hive or JDBC metastore to ensure consistency.

But for object storage such as OSS and S3, their ‘RENAME’ does not have atomic semantic. We need to configure Hive or jdbc metastore and enable ‘lock.enabled’ option for the catalog. Otherwise, there may be a chance of losing the snapshot.

My future experiments will focus on understanding the scenarios that require this level of consistency.

Originally published on Medium

Is there an Alternative to Debezium + Kafka?

Evaluating open-source options to improve performance and scalability in CDC pipelines

I asked this question on Reddit a while back and received lots of valuable answers.

Therefore, I’ve looked into each answer and documented the results in this article.

TL;DR

No, Debezium dominates the market at the moment, despite some drawbacks.

Background Explanation

Why would we want to find an alternative to Debezium? The main reason is we encountered a challenging scenario.

This is a typical scenario for Debezium, where any modifications to the data source are captured and fed into Kafka for downstream processing.

The advantage of this architecture is simple and efficient, ensuring all downstream processes are as real-time as possible.

If the source has a large number of updates, Debezium can scale horizontally until a large number of updates are concentrated in a single table. This is where Debezium hits its limits.

Even though Debezium can scale horizontally, it means the updates originally handled by one process can be distributed to multiple processes. If each table already has a dedicated process, horizontal scaling is no longer feasible.

We are in such a situation, in our environment, even if the machine specification is stretched, the CDC throughput of a single table is capped at 25 MB/s.

This is certainly not a regular case, after all, 25 MB/s change for a single table is quite significant. However, if we encounter a data source that is doing large-scale data migration, this limit can be easily breached.

In order to ensure the real-time performance of our data pipeline downstream, we can only ask the upstream to be merciful when encountering this level of data migration, and try to do a good job of rate limiting.

However, this limitation will greatly reduce the productivity of the upstream developers. On the one hand, they have to add auditing process to their regular maintenance, and on the other hand, they need to develop an additional rate limit for each maintenance.

So let’s find a solution.

Solution Overview

The following solutions were gathered from that Reddit article.

  1. Estuary Flow
  2. Striim
  3. Fivetran HVR
  4. Proprietary CDC
  5. Conduit

The first three solutions are enterprise services without open source, so they’re not going to work for us. After all, we’re trying to solve a partial use case, not a complete do-over.

Although Estuary Flow says they have a local deployment approach, I couldn’t find any information about it.

The fourth solution was to develop a new tool ourselves, which I believe would be a fundamental solution to the problem. After all, Debezium is developed in JAVA, and we should be able to achieve better performance with Golang, Rust, or even C/C++. However, the development cost was too high for us, and it was difficult to start from scratch.

The first four options didn’t meet our needs, but the fifth option caught my attention as a promising solution.

Conduit is an open source data migration platform developed in Golang, and provides a variety of connectors to integrate many data stores. In addition, we can also develop our own converter to do data format preprocessing.

Therefore, I started to test the performance of Conduit.

Expirement Environment

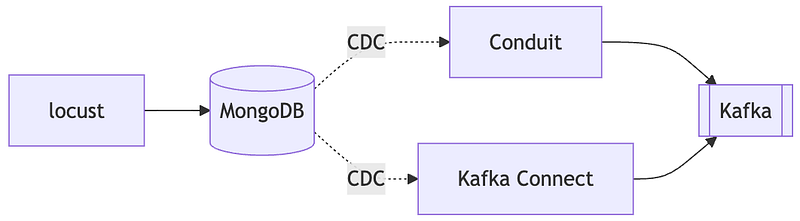
To keep things simple, I used Kafka Connect in place of Debezium. The two are essentially the same but with different dispatchers, and behind the scenes they all use the same library.

Locust is responsible for generating MongoDB changes, then Conduit and Kafka Connect will write to different Kafka topics.

We can observe the writing speed of Kafka topics to determine who has better performance.

The whole experiment environment is as follows.

I use two of my own packaged images, Conduit and Kafka Connect, which have MongoDB connectors.

It’s easy to generate a large amount of change by stuffing MongoDB with a bunch of fat documents and then just changing the value of a field in all the documents.

The locust script used is as follows.

1
2
3
4
5
6
7
8
9
10
11
12
13
14
15
16
17
18
19
20
21
22
23
24
25
26
27
28
29
30
31
32
33
34
35
36
37
38
39
40
41
42
import time  

from locust import User, task, between
import pymongo

class MongoDBUser(User):
wait_time = between(1, 5)

def __init__(self, environment):
super().__init__(environment)
self.env = environment

def on_start(self):
self.client = pymongo.MongoClient(self.host)
self.db = self.client["test"]
self.collection = self.db["test_new"]

@task
def incr_seq(self):
response = None
exception = None
start_perf_counter = time.perf_counter()
response_length = 0

try:
response = self.collection.update_many(
{},
{"$inc": {"seq": 1}}
)
response_length = response.matched_count
except Exception as e:
exception = e

self.env.events.request.fire(
request_type="mongo",
name="incr seq",
response_time=(time.perf_counter() - start_perf_counter) * 1000,
response_length=response_length,
response=response,
context=None,
exception=exception,
)

Load Test Result

For this test, I used a local machine without fully stressing its CPU or memory, leaving some resources available to avoid errors from performance bottlenecks.

In other words, this test shows the regular ability of a single process to handle a single table load.

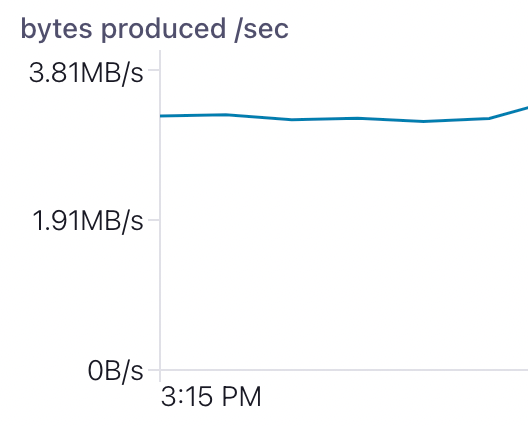
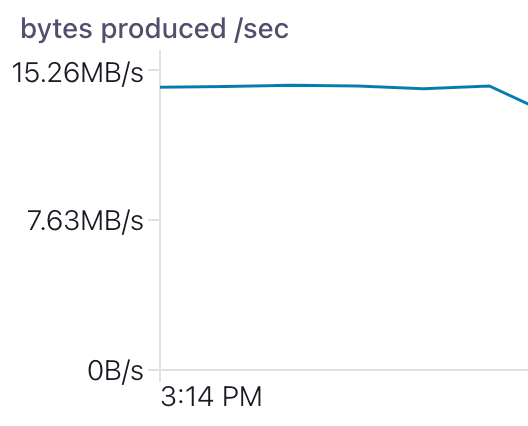
As the results show, Kafka Connect’s throughput significantly outperforms Conduit’s when system resources are sufficient.

I was a bit confused about this result, so I repeated the test a few times, but I got similar numbers.

Wrap Up

Back to the question in the title.

Is there an alternative to Debezium + Kafka?

Not at the moment — at least, not among open-source tools.

I’ve asked on Reddit, but maybe Medium will have a different answer, so feel free to offer your solutions.

Originally published on Medium

NotebookLM Saved My Life

Generative AI combined with note-taking is a game-changer!

Recently generative AI is being used more and more widely, and some of the concepts are both interesting and practical, even revolutionizing traditional industries. One of them is Perplexity, which is gradually replacing traditional search engines, and the other is NotebookLM, which is dominating the notebook market.

Both products have a similar feature with generative AI to quickly summarize data and provide corresponding sources, but the difference is that Perplexity summarizes content from the Internet, while NotebookLM summarizes notes from self-managed records.

Regarding Perplexity, although I use it occasionally, we “ancient” techies are already trained to search for keywords very accurately, so most of the searching requirements are just an open and shut case, and the answers come out without any additional summarization.

Therefore, Perplexity doesn’t quite meet my needs, but NotebookLM is a different story. NotebookLM has completely changed my note-taking behavior.

I believe we can all agree that an architect is a role that requires a lot of reading, whether it’s about various paradigms, patterns, best practices, or even versions of databases and frameworks.

As architects, we constantly need to read a lot of diverse materials, technical documents, books and even technical blogs.

In this context, the importance of notes is particularly obvious. When we read, we must leave a record, otherwise it will be difficult to go back and find the source in the future. However, it’s a tedious task to describe the content accurately, and on the other hand, it’s also extremely hard to search for our own reading logs.

For example, the following is one of my notes in Markdown.

1
2
3
4
5
## Warehousing Design  

- [Slowing changing dimension](https://en.wikipedia.org/wiki/Slowly_changing_dimension)
- [Kimball's Dimensional Data Modeling](https://www.holistics.io/books/setup-analytics/kimball-s-dimensional-data-modeling/)
- [Data pipeline tiering](https://blog.csdn.net/u012501054/article/details/102504760)

Can you guess what’s behind these links? Even I don’t remember, so how could you?

NotebookLM User Experience

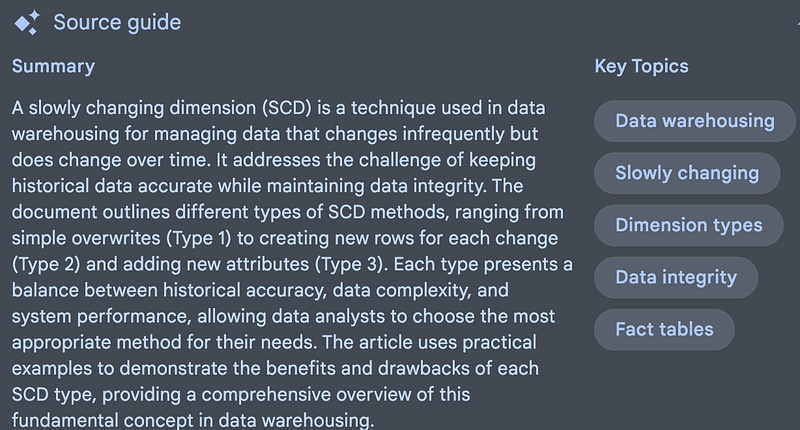
To solve the above problem, we just need to rely on NotebookLM’s auto-summarize function.

It not only summarizes, but even builds table of content indexes to jump directly to the corresponding chapter. In this way, all we need to do is to put all the material we have read into NotebookLM.

It is worth noting that now NotebookLM has a resource limit and can only store up to 50 sources, so the categorization of notes that we would have done in the past is still necessary even on NotebookLM.

In addition to the basic note summarization, NotebookLM’s search function is even more valuable.

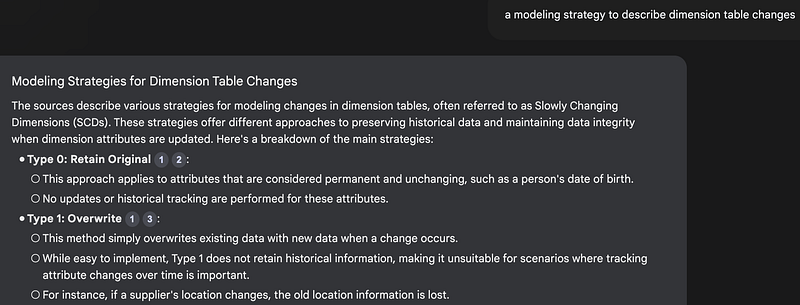
Imagine a situation where we want to model a dimension table, but we find out that the table is not immutable but variable. What should we do? The answer is SCD, but if we forget the keyword SCD, how can we search for the corresponding source?

In NotebookLM, we just ask.

a modeling strategy to describe dimension table changes

Then NotebookLM will tell you about SCD, and even more, it will tell you that there are many forms of SCD with references.

There is another search situation, suppose we read a book a long time ago, when we suddenly need to write a report, how to quickly find out the contents of the book and compile it? Just upload all the books we have read into a notebook and ask questions.

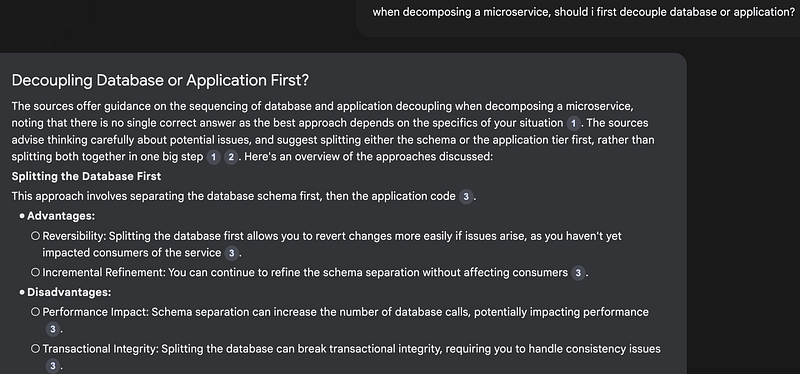
when decomposing a microservice, should i first decouple database or application?

Even if it’s a PDF, NotebookLM still reads it well and provides the references, and those references do jump to the corresponding positions in the book.

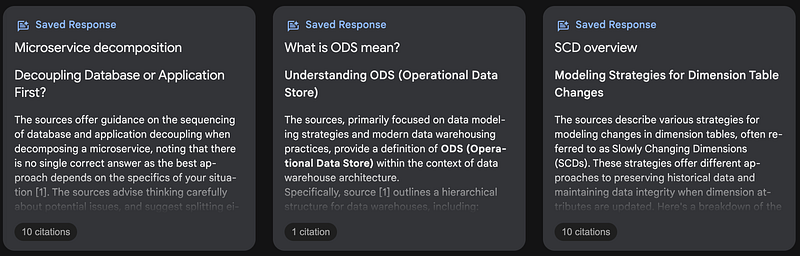
Furthermore, these helpful Q&A’s can be pinned to the notebook for quick tips.

Through these interactions with knowledge, valuable content can be extracted more efficiently and many tedious routines can be eliminated.

I have to say, this has completely changed the way I work.

Wrap Up

Some of the “magic” of NotebookLM is listed above.

  1. Quickly summarize each source.
  2. Quickly locate a sentence or chapter.
  3. Ask and answer questions based on the material, and provide the references.

Just uploading materials to NotebookLM offers unprecedented freedom and peace of mind.

If you haven’t tried NotebookLM yet, give it a shot — you’ll definitely get hooked.

Originally published on Medium

Exploring practical differences between JSONB and JSON_TABLE in PostgreSQL 17

Recently Postgres 17 was released, and one of the features interesting to me was the JSON_TABLE keyword. Postgres has always had an ambition to dominate the database market, and of course that includes document databases.

After the release of JSONB support in previous versions of Postgres, this time JSON structures have been made more descriptive. I was expecting a lot of groundbreaking, but JSON_TABLE looks a bit “ordinary”. In my opinion, JSON_TABLE just provides syntactic sugar, not much difference in usage.

Let’s take a quick look at some examples to get a feel for the difference between JSON_TABLE and the JSONB of the past.

Preparation

Let’s start by creating a table. In order to be as close to the document database as possible, we’ll use a single JSONB column to store all the order data, including the order item and the customer.

1
2
3
4
CREATE TABLE orders (  
id serial PRIMARY KEY,
order_data JSONB
);

Then we put in two orders, each with two items.

1
2
3
4
5
6
7
8
9
10
11
12
13
14
15
INSERT INTO orders (order_data) VALUES  
('{
"items": [
{ "name": "Laptop", "price": 1200 },
{ "name": "Mouse", "price": 25 }
],
"customer": { "id": 123, "name": "John Doe" }
}'),
('{
"items": [
{ "name": "Keyboard", "price": 100 },
{ "name": "Monitor", "price": 300 }
],
"customer": { "id": 456, "name": "Jane Smith" }
}');

Okay, let’s experience JSON_TABLE.

JSON_TABLE vs. JSONB

In the past, when we wanted to query for orders with Laptop we would manipulate items through jsonb_array_elements.

1
2
3
4
5
6
7
8
9
SELECT  
item->>'name' AS item_name,
item->>'price' AS item_price,
order_data -- whole order including Laptop
FROM
orders,
jsonb_array_elements(order_data->'items') AS item
WHERE
item->>'name' = 'Laptop';

So what would this query look like with JSON_TABLE? Let’s see the following example.

1
2
3
4
5
6
7
8
9
10
11
SELECT  
jt.item_name,
jt.item_price,
order_data
FROM orders o,
json_table(o.order_data, '$.items[*]'
COLUMNS (
item_name TEXT PATH '$.name',
item_price NUMERIC PATH '$.price'
)) AS jt
WHERE jt.item_name = 'Laptop';

I have to say the difference is not obvious, but that’s partly because string matching is pretty simple. If we want to look up the price of an item, we’ll start to see the advantages of JSON_TABLE.

Suppose we want to find an order with an item price less than 100, we use the original JSONB as follows.

1
2
3
4
5
6
7
8
9
SELECT  
item->>'name' AS item_name,
item->>'price' AS item_price,
order_data
FROM
orders,
jsonb_array_elements(order_data->'items') AS item
WHERE
(item->>'price')::numeric < 100;

We have to add explicit type casts so that we can compare numbers. But in JSON_TABLE query, since there are already defined type casts, we can compare directly.

1
2
3
4
5
6
7
8
9
10
11
SELECT  
jt.item_name,
jt.item_price,
order_data
FROM orders o,
json_table(o.order_data, '$.items[*]'
COLUMNS (
item_name TEXT PATH '$.name',
item_price NUMERIC PATH '$.price'
)) AS jt
WHERE jt.item_price < 100;

Nested JSON

Now we’ve familiarized ourselves with general JSON manipulation, let’s look at the benefits of nested JSON in a JSON_TABLE.

Let’s start by inserting a few test data.

1
2
3
4
INSERT INTO orders (order_data) VALUES  
('{"order": {"items": [{"name": "Laptop", "price": 1200, "details": {"warranty": "2 years", "color": "gray"}}, {"name": "Mouse", "price": 25, "details": {"warranty": "1 year", "color": "black"}}], "customer": {"id": 123, "name": "John Doe"}}}'),
('{"order": {"items": [{"name": "Keyboard", "price": 70, "details": {"warranty": "1 year", "color": "blue"}}, {"name": "Monitor", "price": 300, "details": {"warranty": "3 years", "color": "black"}}], "customer": {"id": 456, "name": "Jane Smith"}}}'),
('{"order": {"items": [{"name": "Tablet", "price": 400, "details": {"warranty": "2 years", "color": "white"}}], "customer": {"id": 789, "name": "Alice Johnson"}}}');

There is now an additional details attribute for each order item, which contains the color and warranty.

I would like to check the items that are blue in color, and I can do this with JSONB.

1
2
3
4
5
6
7
8
9
SELECT  
item->>'name' AS item_name,
item->>'price' AS item_price,
item->'details'->>'warranty' AS warranty
FROM
orders,
jsonb_array_elements(order_data->'order'->'items') AS item
WHERE
item->'details'->>'color' = 'blue';

As we can see from the WHERE clause above, our chain is starting to get longer. But in the JSON_TABLE query we can keep the WHERE simple.

1
2
3
4
5
6
7
8
9
10
11
12
13
SELECT  
jt.item_name,
jt.item_price,
jt.warranty
FROM orders o,
json_table(o.order_data, '$.order.items[*]'
COLUMNS (
item_name TEXT PATH '$.name',
item_price NUMERIC PATH '$.price',
warranty TEXT PATH '$.details.warranty',
color TEXT PATH '$.details.color'
)) AS jt
WHERE jt.color = 'blue';

Conclusion

In a simple JSON query, JSON_TABLE really doesn’t have any advantage at all. But when the query gets complex, the fact that SELECT and WHERE can still be kept simple under the JSON_TABLE structure is a big advantage.

Personally, I’m happy to see Postgres continue to improve its document database features, which will probably force other SQL based databases to start following along.

Overall, JSON_TABLE is a step forward, and there are many more possibilities for structuring unstructured data in the future.

Originally published on Medium

How SHOPLINE Saves 40% Space in Main Database, Part 2

An in-depth guide to practical data tiering and advanced technical solutions

If you haven’t read Part 1 yet, we suggest you start there. In Part 1 we went through the complete steps of how to start data tiering from the business side.

Let’s quickly review the process from the previous article.

  1. Identify the target that needs to be tiered.
  2. Set the time partitioning for data tiering to occur.
  3. Define the user scenarios for the cold data.
  4. Verify our hypothesis.
  5. Make the right technical selection.
  6. Begin implementation.

When SHOPLINE decides to perform data tiering, based on the above process, we need to know which target to start with first.

After actually counting all the tables, we found that the order related data takes up more than 80% of the main database capacity, and among them, the order and its metadata are the most significant.

Therefore, we finally selected order and order metadata as the first target for data tiering, they are order, order_item, order_payment and order_delivery.

With specific targets in mind, we then need to figure out what kind of time partitioning we want to use in order to minimize the impact on users.

We collected all the REST API calls and their input parameters over a period of time and counted the time interval in which these input parameters were used. From this information, we observed that when an order is older than two years, the frequency of usage decreases significantly, so two years becomes our hypothesis for cold data.

At the same time, the data tiering we want is not to make the data disappear completely, but rather to archive the cold data in a place where it can be used for basic querying.

Although we no longer support complex query criteria and fast response times, we still want users to be able to get the information they want when they really need it, such as information about a particular order or a certain period of time.

This is exactly strategy 4: data warehousing.

In addition, there are many metadata in the order, and even though we decided to archive order_item, order_payment, and order_delivery, we still want to get the rest of the information in a single query in the data warehouse. Then, we still need to find a way to validate which metadata we want to archive.

At first, we made a few changes to the existing UI to observe user behavior. We want to clarify the following issues.

  1. How often users view old data.
  2. What kind of old data the user specifically needs.

Our approach is simple: we have added a two-year restriction to the existing time-selection component so that users cannot select a time period longer than two years. Nevertheless, we will not block the user if he queries directly with the order number.

However, we will mask the order details section so that order details older than two years are collapsed based on metadata. When the user clicks on the exact section, we can track which metadata the user really cares about.

Here’s a little trick.

If we collapse all the details, the user’s first reaction will be to click on all of them. Therefore, we opened the basic information of the order, as well as the payment & logistics, and collapsed only those metadata sections that we wanted to validate.

In the end, we verified both the time hypothesis and the user’s need for metadata. Then, we can begin to formally enter the technical selection phase.

Advanced technical selection

Although we chose data warehousing for cold data storage based on the user scenario, there are still many data warehousing options to choose from.

One of the most important considerations is the existing technical stack.

As mentioned in the previous article, if the existing database naturally supports data tiering, then there will not be so many problems. Also, depending on the existing data pipeline in the organization, there may be viable options.

Let’s take a quick look at the SHOPLINE technical stack.

  • The (former) main database: MongoDB Atlas
  • Main database for data mart: PingCAP TiDB
  • Main Warehouse for Data Pipeline: GCP BigQuery

There are three technology options that can be born from these stacks.

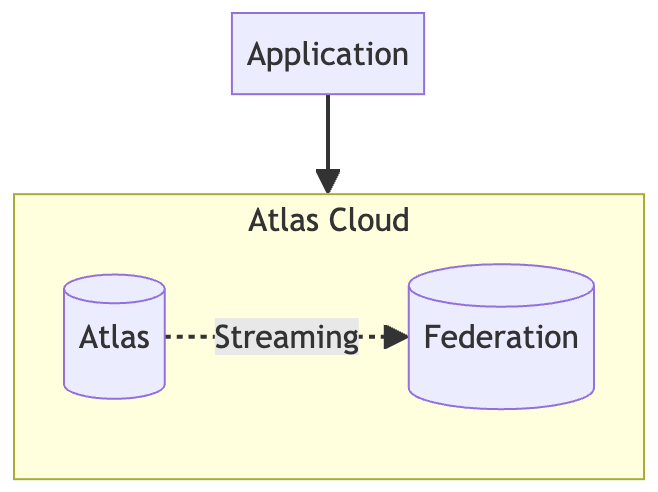
Atlas Data Federation

Data federation is a real-time streaming pipeline developed by Atlas that delivers MongoDB data to the object storage system in a near real-time way.

It also builds an API on the object store to provide querying via MQL.

I have to say, this is an excellent solution. Unlike regular data warehouses that offer SQL capabilities, this Atlas self developed data warehouse offers MQL querying capabilities. For an application that is already using MongoDB and MQL, it’s almost a seamless transition.

Furthermore, the data written to this data warehouse can be generated based on specific aggregation statements, making it quicker to satisfy a variety of scenarios.

Nevertheless, Atlas Federation is a technology that can’t be duplicated — after all, it’s Atlas’ own data warehouse. In other words, once we’ve chosen this solution, we’re vendor lock-in.

PingCAP TiDB Serverless

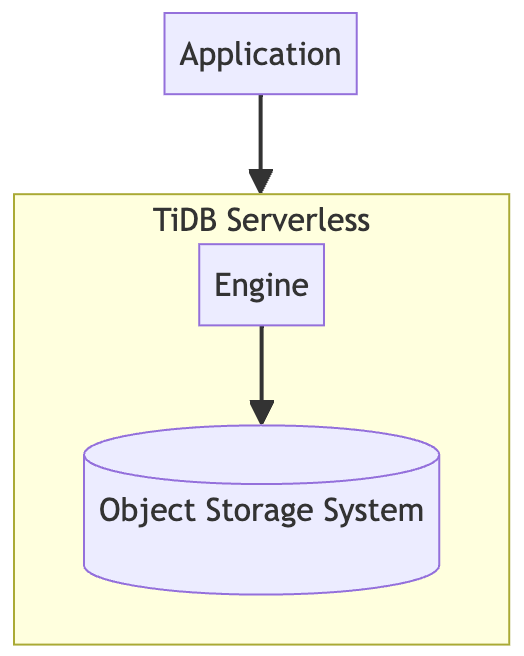
TiDB Serverless is a Compute-Storage Separation architecture, similar to regular data warehouse. It builds a one-tier query engine on top of the object storage system and provides SQL querying capabilities.

When there are no queries at all, the query engine can be scaled to zero to save costs. In other words, when not in use, TiDB Serverless is only a storage cost. This use case is ideal for cold data storage after data tiering.

For an OLTP database, this would be a brand new invention, but for regular OLAP data warehouse, this is not a big advantage.

For us, if we use this solution, on the one hand, it is another vendor lock-in and on the other hand, we need to rewrite the application program significantly to support SQL query.

If we need to rewrite the application to support SQL, why not use a regular data warehouse such as BigQuery, which we are already using?

GCP BigQuery

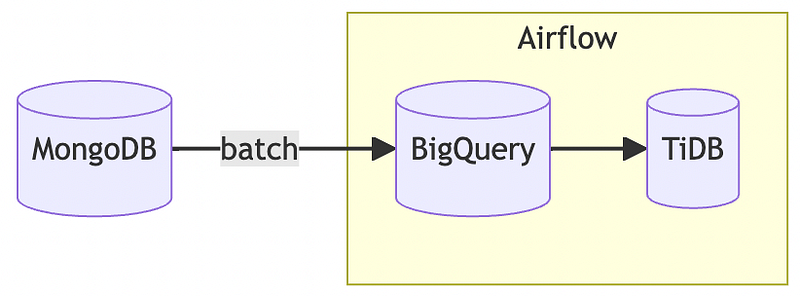
I have described our data pipeline in my previous article.

One of the challenges of using BigQuery as a data warehouse for cold data is that BigQuery is not low cost to query. If directly expose BigQuery to the application, then any misuse could be costly, so for the application, we will send the well organized data to the data mart.

If we put all the cold data from all the orders into the data mart, we are creating another object that requires data tiering. But if we don’t use the data mart, then BigQuery would have to be exposed to application queries, which is against our data governance policy.

Second, BigQuery is also a vendor lock-in that we want to get rid of, so we don’t want to add more use cases to BigQuery.

Self-built Data Warehouse

In fact, we have been investigating the option of building our own data warehouse.

The so-called data warehouse is actually a nearly unlimited and low-cost storage space coupled with a scalable computing engine. The lowest entry point is to store Iceberg in AWS S3 and provide query capabilities through Trino.

To investigate the feasibility of Iceberg, I’ve made many attempts to produce several interesting open source playgrounds.

Since it is a practical and feasible approach and is related to our long-term architectural transformation, it will be our answer.

Leverage the existing data pipeline (Fail)

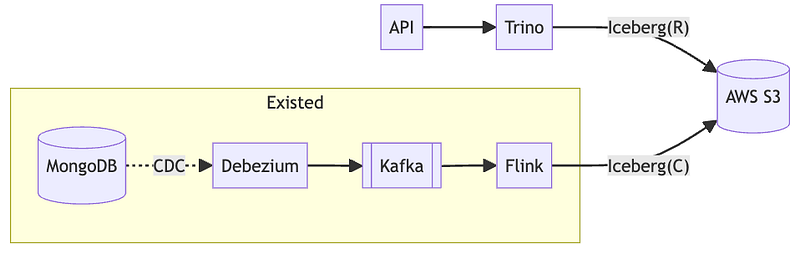
At the beginning, our idea was pretty simple, that is, to leverage the existing data pipeline as much as possible, just put the data into another storage in another format.

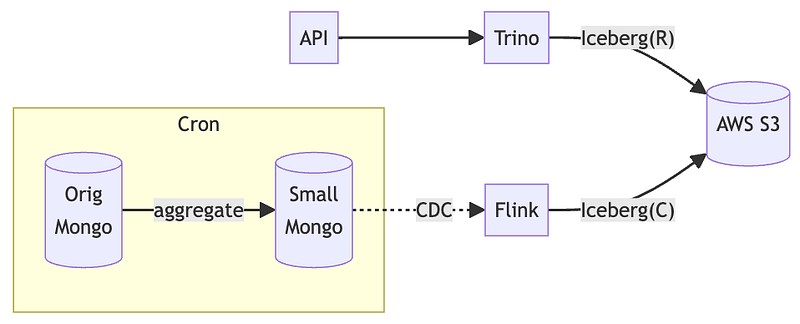
So we defined the following architecture.

As shown in the diagram, most of our components are ready to go, we just need to establish the ability to read and write to Iceberg, which means we can use a real-time data pipeline to accomplish the conversion from hot data to cold data.

When the life cycle of the data reaches its end, we can delete it in real time, because there is a data pipeline behind it that keeps synchronizing all the data.

The data we want to store is actually what the documents look like in MongoDB, just in Iceberg format in S3.

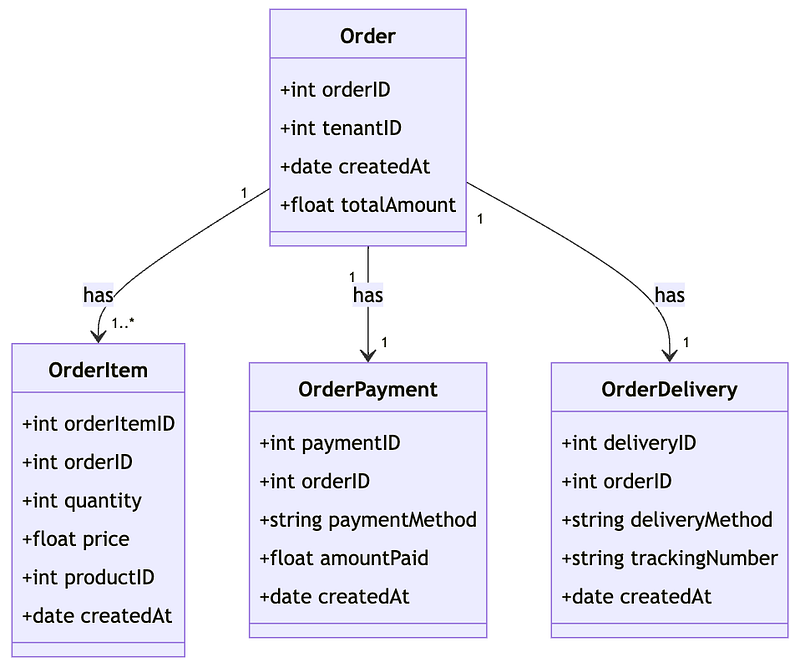
The following ER model is our data model.

The orderID of the order table is a foreign key to the other metadata tables, so only one SQL command is needed to list the orders in a time period.

1
2
3
4
5
6
7
8
9
10
11
12
13
14
15
16
17
SELECT  
o.orderID,
o.tenantID,
oi.orderItemID,
...
FROM
order o
LEFT JOIN
order_item oi ON o.orderID = oi.orderID
LEFT JOIN
order_payment op ON o.orderID = op.orderID
LEFT JOIN
order_delivery od ON o.orderID = od.orderID
WHERE
o.orderDate BETWEEN '2024-01-01' AND '2024-01-31'
ORDER BY
o.orderID;

However, we soon realized a problem. It was difficult to choose a common partition key.

The reason why a common partition key is desirable is because we don’t want to couple the data pipeline with the business logic, so each table should be treated in the same way.

Wouldn’t it be better to use orderID? It’s generic and makes business logic.

No, it’s not.

While orderID may seem like the most appropriate option, in Iceberg’s format, the partition key is the core of file granularity, so using orderID as the partition key will result in an endless number of small files scattered across the object store.

This will not only cause inefficiency in querying but also increase the querying cost significantly.

How about using tenantID as the partition key? This is generic enough and makes business logic as well. But as we can see from the ER model above, those metadata tables don’t have tenantID at all.

In that case, we’ll settle for createdAt, which every table has. This may seem like a viable option, but it’s not actually the case. Because the creation date of deliveries, payments, and even order items may not always be the same as the order, this makes it extremely challenging to write a JOIN query using a partition key.

It seems hard to leverage the existing data pipeline and we have to rethink it.

Creating a cold data wide table

Since the original generic ER model is difficult to model in Iceberg, we need to change our implementation.

First of all, we survey all the scenarios where cold data is used, and we realized what we need is to use the order table as the aggregation root, and take out all the related metadata at once. Then it’s easy, we just need to create a wide table.

But who is going to create the wide table?

Not the data pipeline definitely. Because order as the aggregation root has domain logic, if we let the data pipeline build the wide table, then it means the domain logic has to be copied into the data pipeline as well, which greatly increases the coupling of business logic.

Finally, we design a new cold down process.

We first set up a tiny MongoDB as a relay to store the wide tables, so that the data pipeline only needs to receive the results of the aggregation. In conclusion, the data pipeline has no business logic at all, and it’s up to the application to decide what data it wants to collect.

The application can delete the processed hot data after the aggregation, and any scenario that requires cold data can be obtained directly through Trino.

Conclusion

In fact, the adoption of self-built data lakehouse for data tiering architecture is our first attempt to transform our data infrastructure.

Architecture transformation is a huge task, through each small task, we can gradually divide and implement the whole big task. In the case of this data tiering, it plays the role of a pioneer, allowing our organization to become familiar with the use of the data lakehouse.

When we have control over the data lakehouse we have built, we have the capital to move on to the next step.

As a result, not only did we reduce the space in our main database by 40%, but we also learned how to implement and maintain a data lakehouse. With this experience, we are now able to face more complex challenges.

Originally published on Medium

Dockerize Local RAG with Models

Containerize with Ollama, BGE-M3, and MultiBERT for a complete local RAG system

Previously, I introduced a generic RAG template, in which I mentioned that there are three cores needed to make a high-quality RAG.

  1. embedding with semantic understanding
  2. LLM with contextualized knowledge.
  3. compression result by rerank.

When all of these are in place, a high quality RAG will be created, regardless of whether there is fine-tuning or not.

Add high quality sources and accurate prompts, and you’ve got a complete RAG.

Simple, right?

Is it possible to containerize such a simple yet useful implementation and run it completely locally? Yes, of course.

Let’s take the three models mentioned in the previous template as an example.

  1. Ollama plus TAIDE.
  2. BGE-M3 for embedding.
  3. ms-marco-MultiBERT-L-12 as reranker

Ollama with Models

Ollama is a completely local LLM framework, you can pull down the LLM model you want to use by ollama pull.

Ollama itself provides a basic container.

docker pull ollama/ollama.

Nevertheless, there is no simple way to get this container to mount the model. So here’s a little bit hack, let me demonstrate with a Dockerfile.

1
2
3
FROM ollama/ollama as taide_base  

RUN nohup bash -c "ollama serve &" && sleep 5 && ollama pull cwchang/llama3-taide-lx-8b-chat-alpha1

We use Ollama’s container directly and wake up the ollama service during the docker build process and download the model directly.

This way we have an LLM framework with models.

Packaging BGE-M3

The BGE-M3 here is a HuggingFace supplied model, so all we need to do is find the HuggingFace model catalog and copy it into the container.

In my environment (without modifying any settings), the model directory is at

~/.cache/huggingface/hub/models–BAAI-bge-m3

Therefore, we only need to COPY the contents of this directory into the container.

However, it is important to note that HuggingFace requires config.json when loading models, and this file is very deep.

1
2
3
4
5
6
7
8
9
def init_embeddings():  
from langchain_huggingface import HuggingFaceEmbeddings
HF_EMBEDDING_MODEL = './models--BAAI--bge-m3/snapshots/5617a9f61b028005a4858fdac845db406aefb181'

return HuggingFaceEmbeddings(
model_name=HF_EMBEDDING_MODEL,
model_kwargs={'device': 'cpu'},
encode_kwargs={'normalize_embeddings': False}
)

As we can see from this code, we actually need to specify the snapshot that is used at the moment when using the model.

Well, we are left with the last one, reranker.

Packaging ms-marco-MultiBERT-L-12

The ms-marco-MultiBERT-L-12 used here is integrated by langchain. With the default behavior, langchain’s document_compressors will place the model in /tmp.

In other words, when we run the following code, it downloads the model into /tmp.

1
2
from langchain.retrievers.document_compressors import FlashrankRerank  
compressor = FlashrankRerank(model_name='ms-marco-MultiBERT-L-12', top_n=5)

So what we need to do is copy /tmp/ms-marco-MultiBERT-L-12 into the container.

But that’s not enough, we need to explicitly specify on the client side that the model’s directory has been changed to the container’s current directory. This is a bit complicated to explain, so let’s just look at an example.

1
2
3
4
5
from flashrank import Ranker  
from langchain.retrievers.document_compressors import FlashrankRerank

ranker = Ranker(model_name='ms-marco-MultiBERT-L-12', cache_dir='.')
compressor = FlashrankRerank(client=ranker, top_n=5)

All right, we’ve got the three models we need in the container.

Conclusion

Although this article provides a containerized RAG solution, I have to say that the container image is 18 GB.

If we were to package it with the embedded vectors from the source, it would easily exceed 20 GB.

Therefore, this container can only be used for simple testing, and is not really capable of scaling, so you need to be more careful when using it.

Originally published on Medium

Turn Based Multiplayer Beer Game

Explore supply chain strategy and systems thinking through a game

Since I need to organize a systems thinking workshop in the near future, I need a beer game to start it off.

The beer game itself consists of four characters: Retailer, Wholesaler, Distributor and Factory. Through the time-delay nature of the logistics to understand the system perspective, and can have a better understanding of the system boundaries.

As this is a few hours workshop, I want this beer game to fulfill the following features.

It’s a multiplayer game.

The beer game itself will have many participants playing various roles in the supply chain, but I’d like to be able to have multiple supply chains competing at the same time to see who scores higher. Thus, we can learn about their system strategies at the same time.

The game host should be able to see everyone’s status.

Since there are multiple teams competing at the same time, as a host I need to be able to see how each team is progressing and scoring at the moment.

The game flow has to be simple and easy to control the pace.

As I said at the beginning, this is a short workshop, so I need to get everyone up to speed quickly and I need to be able to control the details of each round.

Moreover, a timer appears in the player’s UI at the beginning of each round, advancing the game pace by counting down.

Be able to customize the characters.

A classic beer game consists of four characters, but the more characters there are, the longer the game will be. So I’d like to adjust the game pace so that it’s better to have three characters.

After searching around, I found that neither open source projects nor projects that are already online can satisfy these requirement perfectly. So, I’d better make one myself.

Beer Game Project

https://github.com/wirelessr/beer_game

The entire project is business driven developed and tested with over 90% coverage, so please feel free to use it.

Preparedness

Create a file for secrets in the project folder. You should see me copy it in the Dockerfile.

.streamlit/secrets.toml

1
2
3
4
5
6
7
8
[mongo]  
uri = "<your mongo connection>"

[admin]
key = "<your admin key>"

[player]
key = "<your player key>"

Since this project is using MongoDB, you have to fill in the link with your account password. In addition, admin.key and player.key correspond to the key fields on the UI.

After all, I’m uploading the app to the public cloud, so I still need a basic authentication mechanism. If you’re running locally only and find authentication troublesome, you can remove the corresponding source code.

Installation and Use

This project has a Dockerfile attached, so it can be run directly with docker.

1
2
docker build -t beer_game .  
docker run --rm --name beer -p 8501:8501 beer_game

For development, in addition to requiremnts.txt, requirements-test.txt, which runs the unit tests, should also be installed. Then you can run all the unit tests through the Makefile.

1
2
3
pip install -r requiremnts.txt  
pip install -r requirements-test.txt
make test

Game Flow

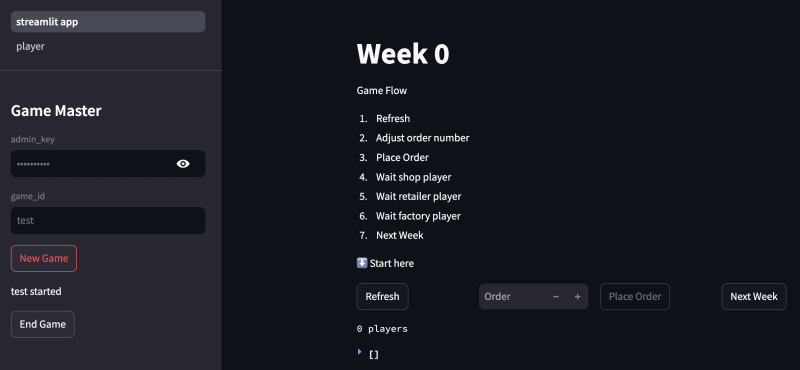
The whole game is divided into a host mode and a participant mode, which correspond to the options in the top corner of the UI.

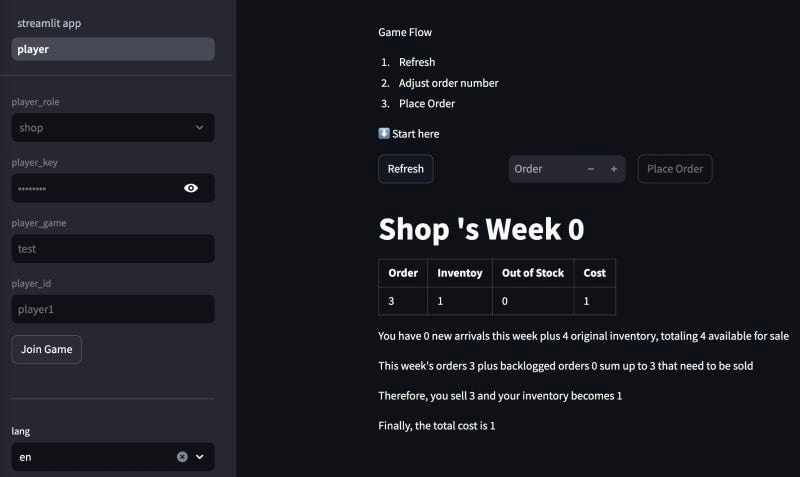
The host first assigns a game_id to create the game, and all participants have to fill in the player_game with this id.

All players on the same supply chain need to use the same player_id, so this id is also known as the supply chain ID, and participants with the same player_id are separated into roles by player_role.

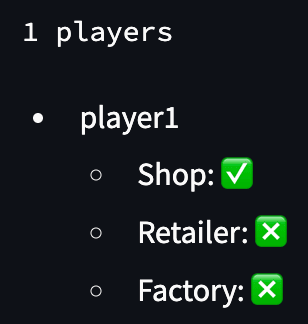
You can see the status on the host’s screen when a participant joins.

Let’s look at what a full iteration would look like from the host’s point of view.

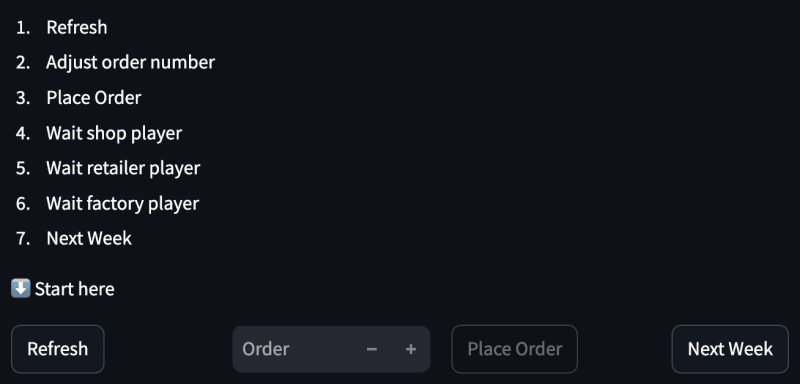
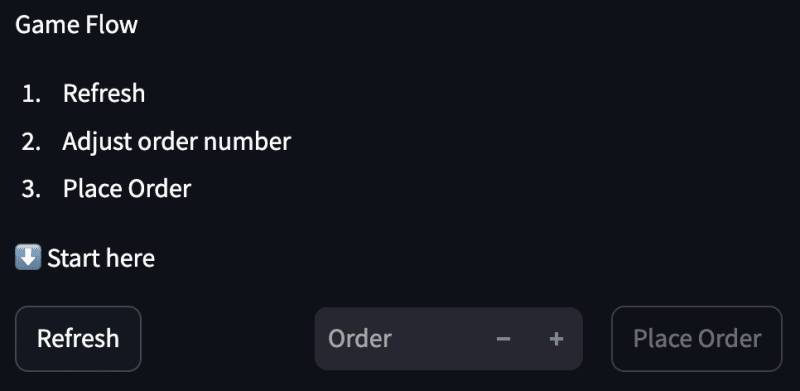
All the components that need to be manipulated are in this picture, and each turn starts by pressing the Refresh button and ends by pressing Next Week.

As for how many orders to send to all the supply chains in this round, they will be triggered by Place Order.

It’s worth mentioning that the Place Order itself is idempotent, so it’s fine to change the number and press it again, the last number will be used. The Place Order of each participant’s interface will be idempotent as well.

Once the host has placed the order, the shop player can take the order.

Similarly, each role in the supply chain starts with Refresh and ends with Place Order, with the shop player taking the action followed by the retailer player, and so on.

Finally, back to the host, who can press Refresh again to see all the statuses for the round, and Next Week to end the round.

Game Detail

There are a couple of things actually done during Refresh.

  1. it refills inventory from downstream based on orders placed four weeks ago.
  2. it receives orders from upstream.
  3. decides how much to sell based on what inventory it can sell.

Since Place Order is idempotent, Refresh itself is idempotent too.

Future work

It basically meets all of my needs now, but there are some enhancements that could be made.

For example, although the host can see the status of all the participants, it would be helpful to have a graph to show the change of inventory and cost information over time, which would be useful for reviewing the game after it is over.

There’s also a more basic problem: the current UI has no test coverage at all, mainly because the current game flow is quite simple. Just a few clicks on the UI will cover all the UI flow, so I don’t rely so much on auto-testing. However, if there is a UI modification, it will still be a bit tedious, so it would be better to have a UI unit test.

Overall, these requirements are optimizations, but their lack does not affect the functionality.

If you have additional ideas, you can also just submit a pull request, contributions are welcome.

Originally published on Medium

How SHOPLINE Saves 40% Space in Main Database

Data tiering in practice: a guide to Hot and Cold data storage

Recently, our organization has been driving a technical transformation where we are tiering data and archiving so-called “cold data” to less costly storage.

Typically, a system must originally use a database that is both fast to access and capable of supporting complex queries, i.e. a database for OLTP scenarios. Inevitably, the unit cost of such a database must be high, which means the more data stored, the more expensive it is, and exponentially so.

Therefore, it is valuable to move some infrequently used data out of the original OLTP database and store it in a lower cost “place”. This process is called data tiering or data archiving.

This “place” is sacrificing many features for price advantages, such as poor access performance. Furthermore, the archived data may never be modified again, depending on requirements, and may only be available for viewing.
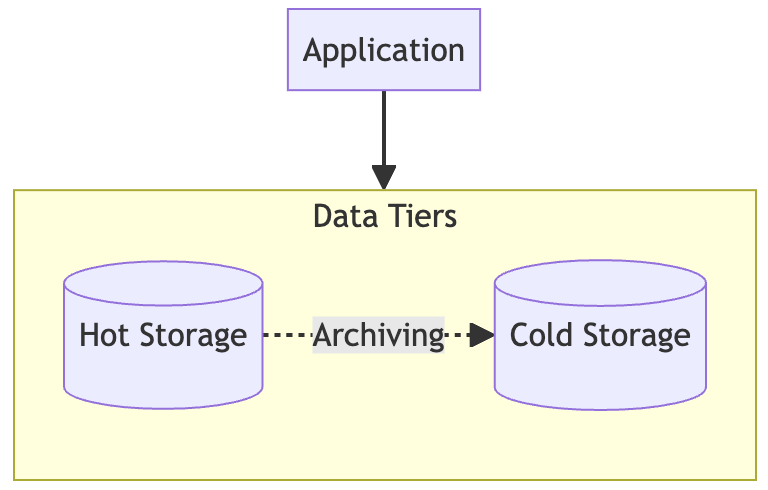
The diagram above provides a clear overview.

Depending on the use case, the application may still have access to all the data, and there may be differences in usage depending on the scenario. However, at the data layer the data has actually been split into two different stores, one fast and costly, the other slow and inexpensive.

Business-driven or Tech-driven?

Do you feel that this organizational transformation is a tech-driven or a business-driven project?

To be honest, this would be a business-driven project. The reason is simple: the act of archiving cold data has a significant impact on the user experience.

When you’re a user of a system, let’s say a bank user, would you want to see all past transactions or just three months of transactions? Undoubtedly, I’m sure you’d want to see all of them, and they’d have to be complete, including time, recipients, amounts, and even notes.

Suppose your bank originally disclosed all the records of the past years, until one day, the bank realized that the cost of data storage is too high and need to archive the transaction records of three months ago, how would you feel?

Unhappy, maybe even quit, right? Yes, that’s why data archiving is a business-driven project.

What is Cold Data?

So, here comes another question. How do we define cold data? I mean what data we have to archive in order to have as little impact on the user experience as possible.

To be able to answer this question, we first need to have observability.

  1. the distribution of data, i.e., the volume of data as a percentage
  2. the time distribution of the data
  3. how users use the data
  4. the time distribution of the data being used

With these metrics we can further analyze which tables need to be tiered, and we can also identify the timing of the tiering.

I believe that the first and second points should be fairly simple, but the critical third and fourth points are almost impossible to obtain without having them built into the system in advance.

So what should we do?

Fortunately, we still have one more tactic, which is the fake door test.

Since we can’t know the context in which the user is using the data, we can make some hypotheses and verify them by making small changes to the application.

For example, our UI can see all bank transactions, but we want to hide transactions from six months ago. We’re not sure if six months is a good time condition, so we’ll just mask the six months ago data on the UI instead of physically archiving it.

In addition to masking, we also wanted to know if this would affect the user experience, so we added a Load More button to record user actions. This way, we know how many users need those six-month old records, and how often they need them.

Moreover, we can take six months as a unit to evaluate how often the data from a year ago or even a year and a half ago is used, so that we can adjust the time hypothesis we set.

Eventually, we can know what is a reasonable cold data from the results of the fake door test.

How to Cold Down

When we have set the scope of cold data, we then need to consider how that cold data will be accessed.

Once again, this is still not a purely tech-driven issue, but is actually determined by business requirements.

Although we all know that the low price of cold data comes at the expense of accessibility, how much impact on the user story will significantly determine our decision.

Here are a few considerations, so let’s discuss them one by one.

User scenario

Once we have clearly distinguished between hot data and cold data, is there a difference in the usage of these two types of data?

Usage here is not about the impact of non-functional requirements such as slow responses, but rather whether we would treat cold data and hot data in the same user scenario.

Continuing with the bank transactions example, let’s assume that transactions older than six months are considered cold.

Here are a few questions to think about.

  1. Should records older than 6 months be able to be displayed seamlessly on the list page?
  2. Should records older than 6 months be able to be displayed via “Load More”?
  3. Can we allow the editing of notes for transactions older than 6 months?
  4. Can we not show records older than 6 months at all?

From top to bottom, we have higher and higher impact on the user story, e.g. in point 3 we allow cold data to be read-only, and even more so in point 4 we allow cold data to be completely inaccessible.

We can know that the more forward options cost more.

Functional limitations

In the user scenarios, we consider whether the cold data is visible and modifiable, but this is not enough.

In the business logic, it is not only about the availability of the records, but also about the aggregation and other operations.

For example, the transaction records can be summed up by month to show the consumption trend, and the consumption percentage can be categorized by transaction targets. Not to mention, there are also some cross-domain data computation requirements.

If we store all the cold data in the form of csv in the object storage system, it is true that we can get a very low storage cost, but all the computing requirements must be parsed out of the whole csv, which will dramatically increase the cost of use.

Therefore, how to balance the cost of storage and the cost of use in terms of functionality is also an important consideration.

Existing technical stacks and data structures

Once we have reached a conclusion on the first two points, the only thing left to do is to fulfill the business requirements within the existing architecture.

Why is this also a critical consideration?

Let’s use a case study to illustrate.

Suppose we decide to treat half a year as a hot and cold junction, and the cold data should be able to be displayed seamlessly on the list page, but it cannot be written to, only read, and all the business logic should be the same as before.

Would this be a harsh condition? It depends. If we’re using Elasticsearch as our main database and defining indexes in terms of time series, then this condition is a piece of cake.

I’ve explained the mechanism and concepts of Elasticsearch’s Index Lifecycle Management, aka ILM. Therefore, it is quite easy to fulfill such business requirements.

However, if our main database is MySQL, then it would take much more effort to accomplish the same business requirement than using Elasticsearch.

To sum up, how to archive cold data depends a lot on the business requirements, but also on the existing technical stack and implementation.

Common Approaches

Let’s list some common data tiering technical options and explain the scenarios where they apply using a few of the mentioned business requirements.

For the sake of simplicity, let’s summarize the requirements. Let’s start with the business requirements and focus on the following three.

  • Readable
  • Writable
  • Aggregatable

In addition to the functional requirements for business, there are also non-functional requirements, so let’s focus on the three core requirements.

  • Storage Cost
  • Computing Cost
  • Access Latency

In addition, I would like to add a key non-functional requirement.

  • Implementation Complexity

Native support

As mentioned in the previous section, when using Elasticsearch’s ILM, there is a simple data tiering architecture when dealing with time-series data.
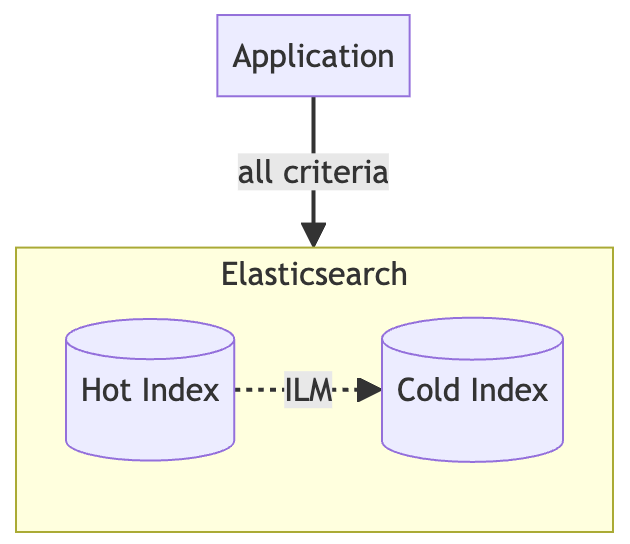
  • Readable (v)
  • Writable (x)
  • Aggregatable (v)

With Elasticsearch’s ILM, it is possible to reduce storage costs by using nodes with poor hardware specifications as cold data nodes, even though the cost is still higher than object storage.

However, because Elasticsearch can keep indexes, query performance will normally reflect the hardware specification savings, and the worse the hardware specification, the worse the query performance will be. Fortunately, this performance loss is still much better than the performance of object storage.

  • Storage Cost (high)
  • Computing Cost (low)
  • Access Latency (low)
  • Implementation Complexity (low)

In fact, if using a database with built-in lifecycle management such as Elasticsearch, then similar characteristics will be available.

Application sharding

It is because of Elasticsearch’s built-in ILM that data tiering can be achieved with little or no modification to the application’s implementation. However, applications that do not use Elasticsearch as their main database are not so lucky, and they have to implement their own sharding logic in the application.

The first step is to prepare two homogeneous databases, one with a high specification for hot data and the other with a low specification.
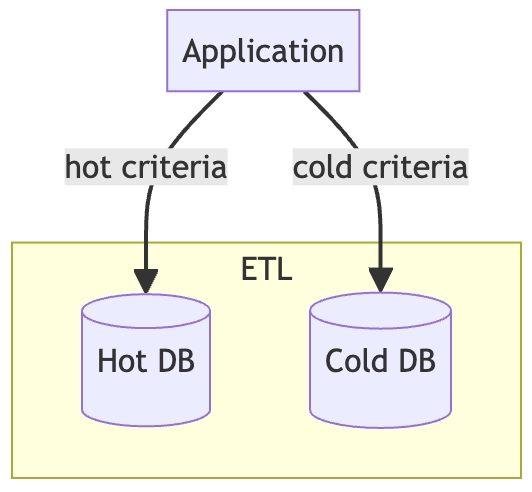
The application determines which database to obtain data from based on the query criteria, and if necessary, it must also do the hot data and cold data join.

The creation of cold data is usually handled by a background Extract-Transform-Load (ETL) process.

  • Readable (v)
  • Writable (v)
  • Aggregatable (v)

Since there are two homogeneous databases, the impact of the usage scenario can be minimized and the ability to write cold data is also available.

  • Storage Cost (high)
  • Computing Cost (low)
  • Access Latency (low)

There is a challenge to be solved in this implementation, there is a time gap between ETL and the application , if this time gap is not dealt with then the user will feel the data loss. A common practice is to reserve a buffer, for example, for an application program to use T for hot/cold junction, so T-1, T-2 will be the cold data accordingly, and vice versa.

In order to avoid the time gap, ETL will prepare the data of T at T-1 in advance at the launch time. Nevertheless, if the data for the T time period is updated then it is possible to encounter data inconsistencies, which require additional handling.

  • Implementation Complexity (medium)

Cold data archiving

The solutions mentioned above are all big technical compromises to minimize business impact, and there is no way to significantly reduce the cost of implementing data tiering in this way.

If we are willing to sacrifice most of the user stories, can we optimize the cost greatly? Yes, absolutely.
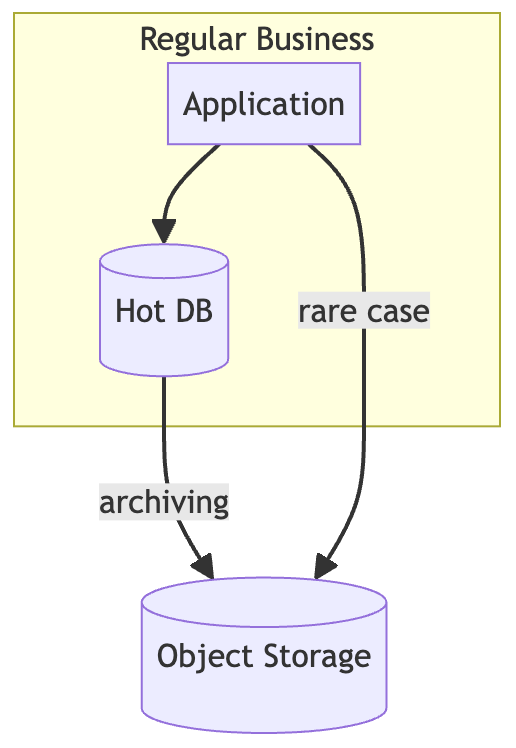
The architecture is also two storage, but one is a database and the other is an object storage system. When we decide the conditions of the cold data, we can start the archiving.

Because of the characteristics of object storage, no schema, no index and long access latency, cold data is not a useful option for applications. For applications, cold data is like disappearing suddenly, and the same is true for users.

This is how the bank transaction records were handled in the first place. Both the application and the user no longer have access to cold data, which is irrelevant in most usage scenarios. Once we need cold data, for example if I want to see a disputed account from a year ago, I have to go to the bank and request a data access.

The data still exists, it’s just no longer easily accessible.

  • Readable (v)
  • Writable (x)
  • Aggregatable (x)

Some applications may keep a history export feature, but more often it’s like a bank where the data is removed right from the user interface.

But this way we get a dramatic cost optimization, because object storage is much less pricey than databases.

  • Storage Cost (low)
  • Computing Cost (x)
  • Access Latency (high)

We’ve sacrificed the business requirements, and instead, we’ve dramatically reduced costs. We can see that I’ve put a cross in the computing cost column because we no longer need to do computing on cold data. Of course, this way we also get an optimized development cost.

  • Implementation Complexity (low)

If such a trade-off is adopted, do not think about satisfying business requirements, as it will only be counterproductive.

Data warehousing

The solutions mentioned so far are all extreme, either highly satisfying business requirements or highly dependent on cost optimization. Is there a middle-of-the-spectrum approach?

Actually, data warehousing is a solution that can satisfy part of the business requirements and achieve part of the cost optimization.

Data warehousing is the process of putting cold data into a “place” that offers low storage costs and the ability to scale computing resources to provide performance when necessary.

Data warehousing services are available in various public clouds, such as AWS Redshift and GCP BigQuery; in addition, there are many vendors offering similar solutions, such as Snowflake.

These data warehousing services have the following characteristics.

  1. Nearly unlimited and low-cost storage.
  2. Scale to zero when not in use to save costs.
  3. Ability to compute large amounts of data.
  4. Response times are not short, at least much longer than databases.
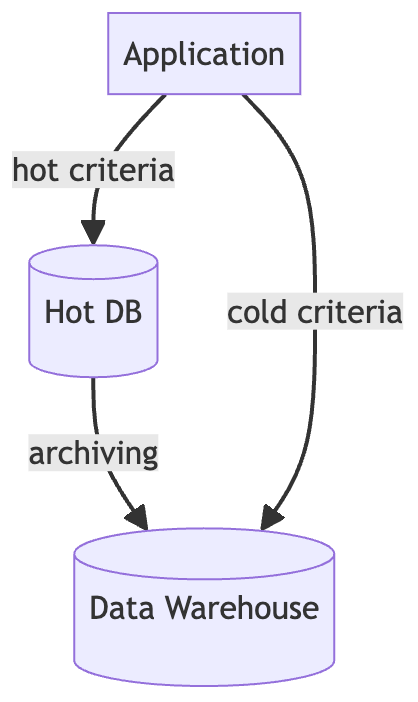
This architecture is pretty similar to simple data archiving, but the difference is that data warehousing provides the ability to perform complex operations, so it can meet some of the business requirements. Of course, everything has a price, these computing power is the cost of exchange.

  • Readable (v)
  • Writable (x)
  • Aggregatable (v)

The reason why there is only a partial business requirement is limited by the latency of data warehouse responses, which may not be experienced well if it is a user-facing feature, so the user scenario needs to be designed in such a way for users to expect a long wait.

In addition, although the data warehouse provides the ability to write, it is not suitable for the regular writing of applications. Because of the long latency and the high cost of a single write, batch processing with archiving is often used.

  • Storage Cost (medium)
  • Computing Cost (high)
  • Access Latency (medium)

It is worth mentioning if the original main database is SQL based, then this transformation is not a major impact on the application, because the data warehouse has SQL support. If the data warehouse and archive are already in place, then the effort of transformation is even less.

However, the latency faced in obtaining data requires a reasonable process, and if the data warehouse is operated as if it were a database, then problems such as timeout may be encountered frequently. This can be mitigated by redesigning the business process.

  • Implementation Complexity (medium)

Conclusion

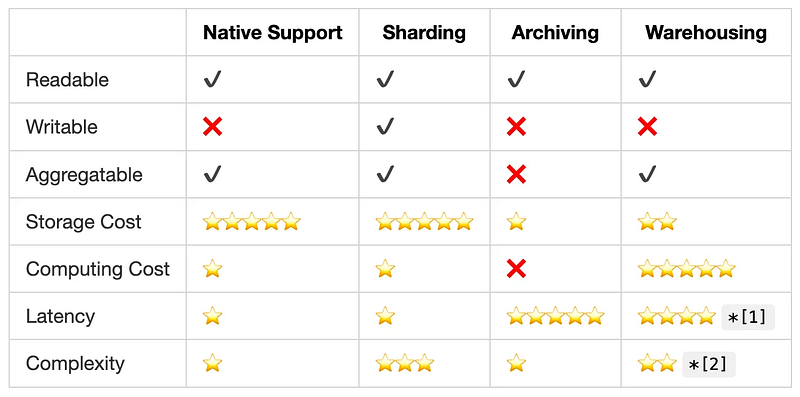
In the previous section we analyzed the properties and trade-offs of different data tiering approaches, so that we can summarize them in a table and assign a rank to them.
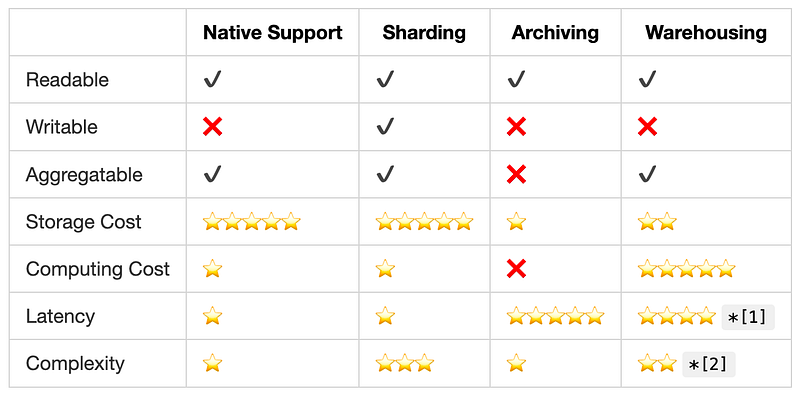
[1]: Data warehousing is also through object storage, but because it creates a catalog and supports selectable fields, it is generally more efficient than just object storage.
[2]: This refers to the fact that the main database is SQL based, which makes it less difficult to implement because of the compromises in the user scenarios. But if the main database is not SQL based, it’s a totally different story.

In fact, there are many variations of these four solutions, depending on the business and technical trade-offs will be adjusted in some details, but the overall concept is basically the same.

We can realize that the task of data tiering, which feels very technical-driven, is essentially business-driven. From the beginning of the user behavior research to the subsequent adjustment of business requirements, this series of trade-offs will affect the entire system experience.

Even so, these trade-offs still require a lot of technical selection behind the scenes, in other words, it is not only a business-driven task.

We all know that data tiering is important and necessary, but how to get the whole thing launch depends on a lot of communication and mutual trust between the business side and the technical side.

With the table above, I believe I can provide you with an easy-to-understand overview of how to adjust your business requirements on a case-by-case basis.

Stackademic 🎓

Thank you for reading until the end. Before you go:

Originally published on Medium

How to Perform ALTER TABLE on Huge Table

Avoiding system crashes: How to safely alter large database tables

I’ve often heard engineers say if the RDBMS table is so large, let’s say millions or even tens of millions of rows, that just adding a new column with a default value will cause the system to crash.

Actually, it’s not that bad.

Well, it’s not that bad if you do it correctly.

Let’s start by understanding why we all have a given idea that this is a dangerous thing to do.

In Postgres, for example, when we want to add a new column with a default value, we execute the following command.

1
2
ALTER TABLE table_name  
ADD COLUMN column_name data_type DEFAULT default_value;

When Postgres recognizes this is an ALTER TABLE command and affects the entire table by default, it requests an AccessExclusiveLock. The lock is a table-level lock and is so exclusive that all other locks cannot coexist, including the lowest-level AccessShareLock, and all SELECTs require at least AccessShareLock, which results in the entire table being stuck.

When this ALTER TABLE is executed on a large table, it means all rows have to be modified and updated to the default values, which also means that it will take a long time and consume a lot of system resources, and then, of course, the system will be crashed.

But we can’t avoid having to make changes to the table’s columns, especially when the requirements are iterative, so what should we do?

Easy for you to say

Let’s start with an extreme ideal scenario, although I realize that most of them are not.

When we expect the table to get this big, we’ll have to partition it.

Continuing with the Postgres example, suppose our order table grows over time and one day overwhelms Postgres. At some point, we should consider partitioning.

Assume we have the following order table.

1
2
3
4
5
6
CREATE TABLE orders (  
order_id SERIAL PRIMARY KEY,
tenant_id INTEGER,
order_date DATE,
-- other columns
) PARTITION BY RANGE (tenant_id);

We can consider partitioning by tenant_id so that the data is spread out in many smaller tables on a tenant basis.

1
2
3
4
5
CREATE TABLE orders_part1 PARTITION OF orders  
FOR VALUES FROM (1) TO (1000);

CREATE TABLE orders_part2 PARTITION OF orders
FOR VALUES FROM (1001) TO (2000);

In this example, each child table would only have order information for 1000 tenants, which would effectively prevent the table from growing to a huge size.

The reality is

But it’s a bit unrealistic to think about partitioning right from the beginning, because the management of a partitioned table is also a bit complicated.

More often cases is the application we developed has grown to be huge without realizing it, and then there is an urgent requirement to iterate, we have to add the columns in a hurry. At this point, it’s too late to create partitions, move data, and rewrite queries.

What should we do?

Well, we need to minimize the negative impact of ALTER TABLE.

First, let’s ignore the default value and set the column to nullable.

1
2
ALTER TABLE table_name  
ADD COLUMN column_name data_type;

Keep in mind, do not insert in the middle of existing columns.

This operation is pretty lightweight and can be done in a very short time even for huge tables.

Next, we’ll start filling in the default values for this new column in batches with the primary key.

1
2
3
UPDATE table_name  
SET column_name = default_value
WHERE primary_key_column BETWEEN start_value AND end_value;

Remember, it has to be a batch, i.e. just a few hundred rows at a time, and we’ll do it in batches until all the new columns in the table have values.

The reason for the batch is because the lookup of the primary key is extremely efficient, and each update only locks a portion of rows, which on the one hand improves efficiency, and on the other hand reduces the scope of the affected data.

Finally, we change the columns back to what we wanted at the beginning.

1
2
ALTER TABLE table_name  
ALTER COLUMN column_name data_type DEFAULT default_value;

This operation will take a little longer than the first step, but it is acceptable.

Splitting a command with a huge impact into three steps, each step with a limited range of impacts, will allow the avaiability of the system to be increased dramatically.

Conclusion

In this article we have not only explained the risks of doing an ALTER TABLE on a large table but also suggested specific ways to deal with them.

Ideally, if you’re using an RDBMS, you’ll want to consider partitioning, or even sharding, before your data grows out of control. Most RDBMS don’t have built-in sharding mechanisms, so you’ll need to use an application to do the sharding.

But the reality is that we often have to operate on existing large tables, so this article proposes a feasible solution. To make the most reasonable consideration, be cautious but don’t be overtaken by hesitation.

Originally published on Medium
不要跟我五四三,回點有用的話來

這篇文章是專門為了繁體中文的 RAG 寫的。

你有覺得聊天機器人一直在打高空嗎?
你有覺得聊天機器人總是瞎掰胡謅嗎?
你有覺得聊天機器人經常答非所問嗎?

如果你使用的 prompt 已經很精準了,卻還常有上述感受,那很有可能你實作的 RAG 出了根本上的問題。

要讓 RAG 務實有以下幾個重點:

  1. 必須是要懂繁體中文的 embedding
  2. 要有中文語意的分片器
  3. 一定要是用繁體中文訓練的 LLM
  4. 精準的 prompt 連同 system instruction
  5. 沒做 rerank 的效果都差到不行,但 rerank 要懂繁體中文

能夠做到上述五點,那麼你就可以得到一個穩重且有參考價值的 RAG。

核心概覽

以下我會提供一個使用 langchain 實作的繁體中文萬用套餐,最重要的是:本地運行,完全免費。

既免費又萬用的核心元素是下列:

  1. 懂中文的 embedding:BGE-M3
  2. 中文語意的分片器:RecursiveCharacterTextSplitter
  3. 繁體中文訓練的 LLM:TAIDE
  4. 懂繁體中文的 rerank:ms-marco-MultiBERT-L-12

上述都是免費的,搭配本地運行的框架:

  1. Ollama
  2. Langchain

就可以實作我們要的務實 RAG。

具體實踐

把 Ollama 裝好,有 Python 後就開始吧。

以下我會用一個 Confluence 的爬蟲做示範,但整個腳本可以套用在任何繁體中文的資料源。

1
2
3
4
5
6
7
8
# Langchain 的核心套件  
pip install langchain langchain-community langchain-core langchain-huggingface
# Confluence 爬蟲需要的套件 (根據資料源可替換)
pip install atlassian-python-api lxml pytesseract docx2txt
# Rerank 用
pip install flashrank
# 向量存儲
pip install faiss-cpu

Python 套件都安裝完成後的第一步,我們要先準備給 RAG 使用的資料源,以本例來說是 Confluence。

1
2
3
4
5
6
7
8
9
10
11
12
from langchain_community.document_loaders import ConfluenceLoader  

CONFLUENCE_TOKEN = '<your token>'
USER = '<your account>'
ROOT_URL = '<your domain>'
SPACE_KEY = '<your space>'
PAGE_ID = '<your page>'
loader = ConfluenceLoader(
url=ROOT_URL, username=USER, api_key=CONFLUENCE_TOKEN
)
documents = loader.load(space_key=SPACE_KEY,
page_id=PAGE_ID, include_attachments=True, limit=50)

到此,Confluence 的資料就全部抓下來並存進 documents 了。

若你要處理的是別的資料源,就直接從這裡往下,重點是所有資料要放進 documents。接著我們要來做分段,許多英文的教學會使用 token 來做分段,但中文與 token 並沒有很好的對應,效果會非常差。因此,我們依然採用標點符號的分段方式,並且讓上下兩片段是有重疊的。

1
2
3
4
5
6
7
8
9
10
11
12
13
14
15
16
17
18
19
20
21
22
from langchain.text_splitter import RecursiveCharacterTextSplitter  

text_splitter = RecursiveCharacterTextSplitter(
chunk_size=800,
chunk_overlap=400,
length_function=len,
is_separator_regex=False,
separators=[
"\n\n",
"\n",
" ",
".",
",",
"\u200b", # Zero-width space
"\uff0c", # Fullwidth comma
"\u3001", # Ideographic comma
"\uff0e", # Fullwidth full stop
"\u3002", # Ideographic full stop
"",
],
)
texts = text_splitter.split_documents(documents)

上面程式碼可以看到,我們對中文的全型逗號和句號做了額外處理,想要加入更多字元也行。

另一個關鍵是我們的片段長度是 800 且重疊 400 字,這是我實測下來最理想的長度了,當然也可以根據需求調整。

接著我們準備開始做 embedding,務必記得,embedding 的模型一定要懂繁體中文。現階段,既免費效果又好的當屬 BAAI/bge-m3

1
2
3
4
5
6
7
8
9
10
from langchain_huggingface import HuggingFaceEmbeddings  
from langchain_community.vectorstores import FAISS

HF_EMBEDDING_MODEL = 'BAAI/bge-m3'
hf_embeddings = HuggingFaceEmbeddings(
model_name=HF_EMBEDDING_MODEL,
model_kwargs={'device': 'cpu'},
encode_kwargs={'normalize_embeddings': False}
)
vectordb = FAISS.from_documents(texts, hf_embeddings)

現在我們已經有一份完整的向量放在記憶體內了,至於是否需要落地,也是根據需求決定。

最後就是聊天對話了,讓我們用 langchain 的內建功能快速搭建起來。

1
2
3
4
5
6
7
8
9
10
11
12
13
14
15
16
17
18
19
20
21
22
23
24
25
26
27
28
29
30
31
from langchain.prompts import PromptTemplate  
from langchain.chains import RetrievalQA
from langchain.retrievers.document_compressors import FlashrankRerank
from langchain.retrievers import ContextualCompressionRetriever
from langchain_community.llms import Ollama

LLM_MODEL = 'cwchang/llama3-taide-lx-8b-chat-alpha1'
RERANK_MODEL = 'ms-marco-MultiBERT-L-12'

llm = Ollama(model=LLM_MODEL)
custom_prompt_template = """
<your system instruction>
{context}
Question: {question}
Helpful Answer:"""
CUSTOMPROMPT = PromptTemplate(
template=custom_prompt_template, input_variables=["context", "question"]
)
retriever = vectordb.as_retriever(search_type="similarity",
search_kwargs={"k": 100}) # K1, Top100 Snippets
compressor = FlashrankRerank(model=RERANK_MODEL, top_n=5) # K2, Top5 Answers
compression_retriever = ContextualCompressionRetriever(
base_compressor=compressor, base_retriever=retriever
)
qa = RetrievalQA.from_chain_type(llm=llm, chain_type="stuff",
retriever=compression_retriever, return_source_documents=True)
## Inject custom prompt
qa.combine_documents_chain.llm_chain.prompt = CUSTOMPROMPT
question = "<your question>"
answer = qa({"query": question})
print(answer)

上面這段 code 有幾個重點:

  1. 採用 Ollama Hub 內有的 TAIDE 模型 (整合好的比較方便)
  2. Rerank 模型則是 langchain 整合的 ms-marco-MultiBERT-L-12
  3. 先用向量的相似性比對找出前 100 名,接著透過 rerank 找出最佳的 5 個
  4. 雖然 answer 只會有一個答案,但 return_source_documents=True 所以可以看到參考了哪些結果

結論

上面那整段 code 都只需要本地運行,硬碟大概需要 10 GB 左右,但因為不需要 GPU ,所以一般手上的電腦都可以跑。

雖然是以 Confluence 爬蟲作為例子,但相信你們都可以發現,langchain 這個框架其實整合的相當好,大部分的工作都可以簡單幾行 code 就處理掉。即使是需要一定 know-how 的 rerank,也已經有內建的整合可以直接使用。

至於腳本內沒提到的 prompt 和 system instruction,那個必須根據你的用途和語料來動態調整,所以如果使用這個腳本還碰到不夠精準的回答,那多半是這兩點沒調校好。

Originally published on Medium
0%