Hexagonal Architecture: The Best AI Vibe Coding Guide
Boost review efficiency and code accuracy using layered architecture with AI
I finally found a development workflow that suits me best. It is highly efficient and ensures extremely high accuracy at the same time.
I think we can all agree on delegating the tedious task of coding to AI as much as possible. We humans just need to define what to do and verify the results. But I am not sure if we have noticed a problem. Humans eventually become the blocker in the whole process. AI writes code incredibly fast. We simply cannot do a complete code review. This usually results in an “always approve” situation.
This “always approve” habit is the exact reason why various bugs keep popping up. AI is great at writing code. However, it definitely does not guarantee zero mistakes.
So how can our review process keep up with the speed of AI? This is a question I have been thinking about lately.
Actually, the answer is already there. Long before AI came into the world, we already had a methodology to improve software maintainability. That methodology is layering.
Yes, layered architecture is nothing new. I have also written many articles about how to implement layered architecture and Domain-Driven Design (DDD). The most classic one is this article.
But in fact, I only favored basic layering in the past. I did not favor extreme layering strategies like hexagonal architecture. However, it is exactly the hexagonal architecture that can completely solve the current problem of inefficient reviews and excessive errors. Let us see why.
Hexagonal Architecture
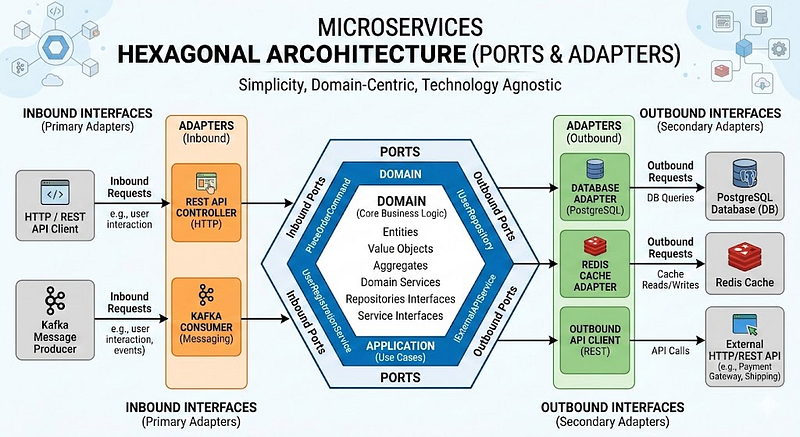
This is a classic hexagonal architecture diagram. It has a few key points.
Clear external dependencies. This includes the inbound interfaces (ports) flowing into the service and the outbound dependencies. All external dependencies have clear and well-defined interfaces to set the boundaries.
Every external dependency has a corresponding adapter for implementation. For instance, a Postgres has a database adapter. External API calls have REST adapters.
Inside the service, aside from boundary definitions, the rest is purely domain-specific business logic.
I believe even those unfamiliar with clean architecture or DDD can easily see the strengths of hexagonal boundaries from this diagram.
But the main reason I did not promote hexagonal architecture in the past is the manual labor involved. All these layers, adapters, and boundaries require manual coding one by one. This involves a massive amount of coding effort just to describe specifications instead of actually solving problems.
Therefore, at that time, hexagonal architecture would ironically become another blocker. It was not a review blocker but a coding blocker.
Let me give a classic example from my own experience. I can build three APIs in Golang with about 600 to 1000 lines of code, excluding tests. But if I use hexagonal architecture, it takes about 3000 to 4000 lines of code. This means 4–5x more effort, or even more, just for coding.
Vibe Coding Era
But times have changed now. Writing code is no longer the bottleneck. As long as we have clear and specific specifications, AI can easily generate thousands of lines of code.
That is right. Clear and specific specifications are exactly the strengths of hexagonal architecture. And the shortcomings of hexagonal architecture are perfectly covered by AI. They are a perfect match.
So what are the benefits of hexagonal architecture for us today? Let me explain using a concrete development workflow.
When we need to develop a complex microservice API, it will have many external dependencies. These include RPC between services, its own data storage, and even complex business logic.
We can manage all of these using the following development workflow. This is a specific example from a project I am currently working on. I strictly followed everything defined by hexagonal architecture.
Phase 1: Domain and Ports
Details: Struct fields and interface method signatures.
Human Focus: Check if the design is correct and if anything is missing.
Phase 2: Repository
Details: SQL, SQLC, and mapping.
Human Focus: A quick glance is enough. Tests will catch errors.
Phase 3: Infrastructure
Details: HTTP adapter, middleware, and Wire.
Human Focus: A quick glance is enough. If it compiles, it is mostly fine.
Phase 4: Service Layer
Details: State machine, validation, and notification.
Human Focus: Read line by line to ensure business rules are correct.
Phase 5: Integration Test
Details: 16 DB tests.
Human Focus: Ensure important scenarios are covered.
We can almost completely let AI write code for all phases. Each phase will correspond to a complete PR. This naturally includes a complete CI/CD process.
We can see that the scope requiring my careful review is clearly defined. It only includes phase 1 and phase 4.
Once I deeply verify in phase 1 that the interfaces of every external dependency are defined correctly, the behavior of the entire microservice is basically solid. Then, I just need to verify the internal core business logic is correct. This keeps the quality of the entire microservice at a high level.
Wrap Up
Through the strict layering of hexagonal architecture, we can easily achieve separation of concerns. We only need to focus on where we must focus. For the rest, we can trust the power of AI.
This is the core reason why I am embracing hexagonal architecture again in this era.
When we have the correct interfaces, even if errors occur, they will not be disastrous. Moreover, reviewing interfaces is relatively easy for humans.
I have been running this workflow for a while now. Facts prove that it is highly effective. It can significantly boost overall productivity. After all, we always say humans are the bottleneck of AI. I am working hard to eliminate this blocker.
How to adapt to the unstoppable AI wave and new agent-driven workflows
My last article wrapped up at the end of 2025. This means I haven’t put out anything new for a few months.
I have a few direct and indirect reasons for this.
Direct Reasons:
Winter is when I take long vacations for skiing and outdoor activities. The snow conditions are perfect in January and February.
I need to stay extra focused on work to make those long breaks happen.
I used to spend a lot of energy on Copilot. Now I am moving to Claude Code. It takes a lot of time to fine-tune the new workflow.
Indirect Reasons:
I noticed that fewer people read traditional or digital media in the AI era. This includes platforms like Medium.
Most new learning principles and methods are actually the same as before. Only the tools changed.
I can already delegate most tasks to agents. There isn’t much left to share.
One major point to watch is media influence.
I used to work in e-commerce. I know how traditional operations work. This includes things like SEO, ads, and CRM. But AI is taking over the entry points for media. In the future, people might not even browse stores. AI will just place the orders directly. Traditional methods will not be very effective then.
This is happening on platforms like Medium too. To be honest, my month-over-month views on Medium are dropping fast. My revenue reflects this as well. This is a huge turning point for content creators. We must adapt to this new digital transformation. If we don’t, we will get left behind.
Another key point is tool integration. Every coding tool uses the same models now. The winner will be whoever can build a better workflow.
Let’s look at Skills as an example. Claude Code launched Skills to fix a major pain point with MCP. Usually, listing an agent’s abilities eats up a lot of context. Skills provides an index instead. The agent only reads the details when it actually needs a specific ability.
This concept is simple. I was already using Copilot this way before Skills even existed. I wrote my own Markdown files for common commands like gh.md, jira.md, and confluence.md. I told the agent about these files in the system prompt and to check those files when it needed details.
This gave the agent clear instructions for platforms like GitHub or Jira. This is exactly what Skills does. Claude Code just made it a built-in feature. Copilot recently added a similar Skills concept too. These are not groundbreaking features. They are just workflow integrations. But these tiny tweaks are what created the massive agent ecosystem we see today.
I didn’t feel a massive jump in quality when I moved from Copilot to Claude Code. Instead, the whole process just felt smoother. Take Hooks for example. I used to spend a lot of time tuning Copilot to get them right. Claude Code has them built-in. This makes everything much easier.
These are my takeaways from working and learning in 2026. I can’t put together a fully structured report yet. But I can say one thing for sure. This AI wave is unstoppable.
Learn how Keep-Alive connections can drain your Gevent pool and crash pods
Recently, we have been troubleshooting a stubborn issue. Pods kept restarting for no apparent reason. The cause was liveness and readiness probe failures.
This sounds common, right? But here is the catch. We had already tuned our liveness and readiness probes to be as simple as possible. Like this:
Even with this setup, we still saw liveness and readiness failures.
Before we dig into the problem, let’s look at the microservice’s infrastructure. First, it is a Flask application. However, we aren’t using Gunicorn for concurrency. We are using Gevent.
This means each pod is effectively a single-process Flask app. It uses coroutines, or “greenlets,” to handle each request. Now that we understand the setup, let’s analyze the root cause layer by layer.
Question 1: Why does such a simple health check fail?
Logically, a “Hello World” response shouldn’t trigger errors or timeouts. So why did the health check fail?
We have to look at the design. To prevent resource exhaustion, we configured a Gevent pool. Whenever a request comes in, we grab a greenlet from the pool to handle it. If the pool is empty, we can’t handle any requests. Not even the simple ones.
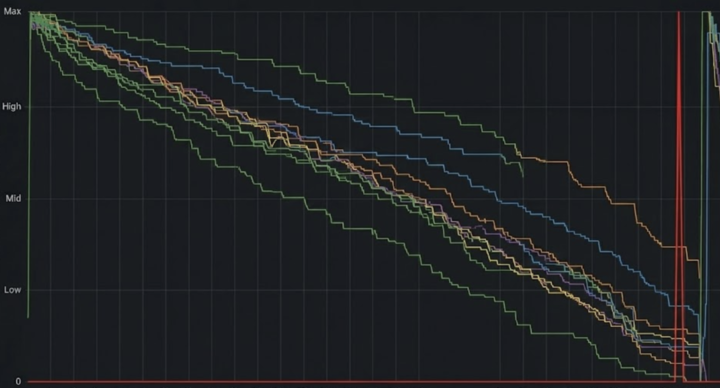
Take a look at the graph below.
The red line shows the number of pod restarts. The other lines show the remaining capacity of the Gevent pool, which keeps dropping. When the pool hits zero, the app can’t respond to health checks. This triggers a pod restart.
After the restart, the Gevent pool in the new pod becomes available again, and it can resume service.
Question 2: Why does the Gevent pool run out?
We know the immediate cause. Now we need to find out what is consuming the Gevent pool. We need to understand why we ran out of greenlets.
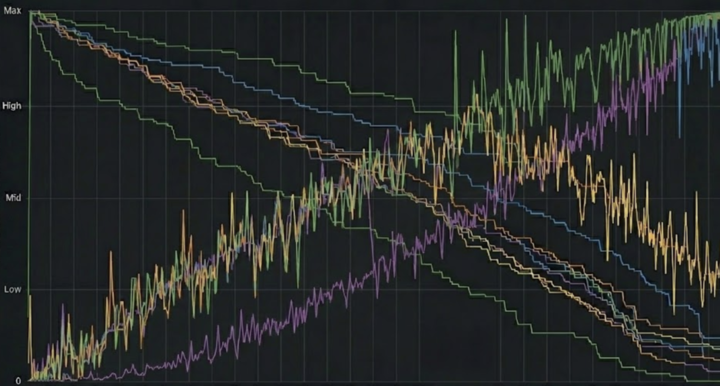
At first, we suspected high CPU usage. If the CPU spikes, every request takes longer to respond. This would mean each greenlet is occupied for more time.
Eventually, this creates a slow leak.
The overlay of the Gevent pool and CPU usage seemed to support this theory.
However, further analysis proved us wrong. Even when the CPU spiked, the peak usage never hit the full CPU request limit for the pod. We also didn’t see any signs of CPU throttling. So, this hypothesis didn’t hold up.
Question 3: Is it a Gevent leak?
To figure out what is holding onto the greenlets, we need to dump the current greenlet stack. Fortunately, Gevent provides a tool for this: gevent.utils.print_run_info.
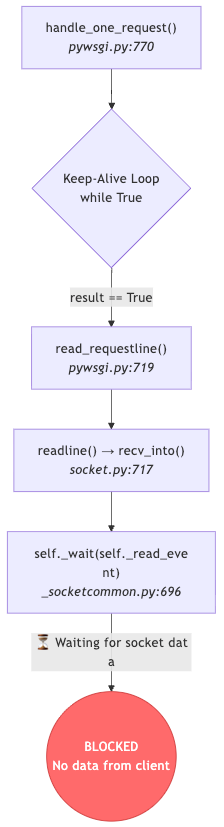
We used this to analyze the dump and see what each greenlet was doing. We found a huge number of greenlets waiting on read_requestline.
Below is a breakdown of the code flow.
This is typical HTTP Keep-Alive behavior. If a client keeps the connection open but doesn’t send a request, the greenlet waits indefinitely.
Now we have our answer. The greenlets were being forced to stay alive because of the Keep-Alive setting. This eventually drained the Gevent pool.
Question 4: Who is hogging the connections?
We have another way to prove that Keep-Alive is the culprit. We can use netstat to check the status of the TCP connections.
First, let’s verify if there really are persistent TCP connections.
Now we know the source IPs. We can analyze who these sources are and figure out how to handle them.
Wrap Up
In fact, there are more questions to answer:
Question 5: Who exactly is the source?
Question 6: Why do they open connections but not close them?
However, these answers depend on the specific infrastructure environment. I won’t go deeper into those details in this article.
Still, this Root Cause Analysis process should apply to almost any web service. It is especially useful for Python services. By following the flow in this article, we don’t have to blindly suspect CPU or memory issues every time something goes wrong. We have the tools and methods to track down deeper problems.
Discover why I ditched SDD for an efficient Vibe Coding workflow
I recently made some major optimizations to the workflow I use for running development tasks with AI agents. I’ve completely abandoned SDD (Spec-driven Development) and shifted to pure vibe coding.
Even though I used to be a big believer in SDD, I’ve realized its limitations and the new problems it creates over the last few months. I’ll summarize the reasons for the switch and what we’ve found.
There is actually an article on Martin Fowler’s blog that analyzes SDD tools and processes in depth. I happened to switch my process before seeing that article. It turns out the content mirrored my feelings perfectly, so I highly recommend reading it.
Back to the main topic. Why give up SDD completely? Let me summarize it in one sentence.
Using SDD for small changes is overkill. Big changes can’t be explained clearly. Even if the documentation is written perfectly, the Agent can’t fully absorb it. Eventually, the documentation and the code drift further apart.
Let’s discuss each of these points in detail.
Small changes are unnecessary
The small changes we refer to here are usually things like receiving a bug report or a feature enhancement. This could be tweaking parameters or adjusting part of a flow.
When we need to execute this kind of small task, let’s take Kiro as an example. Would we use vibe mode or spec mode?
When I was a devout SDD believer, I always used spec mode. And what did that get us?
Three lines of code changed. Over three hundred lines of documents generated.
I don’t know if you’ve had experience using SDD tools, but even for these tiny tasks, their requirement documents still cover backward and forward compatibility, security assessments, performance reviews, and rollout plans.
Are you kidding? The time it takes to read the generated requirement document far exceeds the time it takes to just jump in and write the code myself.
Big changes aren’t explained clearly
Big changes are the flip side of small changes.
When we need to make a change involving thousands of lines (allow me to use numbers for clarity), this scenario is usually where SDD is supposed to shine, right?
The reality is different. When we give a PRD directly to a spec mode agent, it can’t produce a complete, well-broken-down task list. It easily misses things. And when a massive list actually gets to the agent for implementation, it turns out to be something entirely different.
If we have to teach the agent to build a complete list through interaction and conversation, why not just grab the list and do it ourselves?
More importantly, the agent’s context window is limited. When action items aren’t small or precise enough, it will still implement things according to its own ideas, even with a complete design doc.
This turns into a situation where the agent writes bad specs, and we need to assist it in writing them. Then, once the agent has the specs, it doesn’t follow them well, so we have to supervise it. We basically end up becoming the maintainers of the specs ourselves, which adds a lot of extra effort.
Agents can’t fully absorb even clear documentation
There are already many papers analyzing this. I’ve even done quite a few experiments and verifications myself.
You can refer to my articles and open-source projects for details.
Simply put, the agent won’t treat the design document as an absolute law. It only treats the design document as a guideline. Sometimes, it doesn’t even read the whole thing.
The result is that we spend a lot of time discussing a perfect design with the agent. But in the end, we still need to watch over the agent constantly to make sure it doesn’t go off track.
Documentation and code drift apart
This is the fate of software development. It applies to the past and the future.
Because documentation only increases and the codebase only gets bigger. No one can remember all the content in the documentation. And no one can update the relevant documents with every single change.
Whether it’s the Wiki and Confluence of the past or design docs written inside the codebase, they share the same fate. Eventually, they will no longer be consistent with the code.
The problem lies exactly here. When Wiki or Confluence is inconsistent, we humans might notice it or we might just ignore those documents. But the stuff you write in .kiro/steering gets pulled out and referenced by the agent repeatedly. If the document content is outdated, sadly, the agent’s changes will be a disaster.
How do I do it now?
Having said so much about the downsides of SDD, how do we handle things now?
I believe thinking before coding is essential, whether we are using AI coding or not. Therefore, I still keep my past habits. I analyze and design the modifications I’m about to make. The difference is that in the past, we needed to know every aspect of the codebase to make a complete analysis. But now, collaborating with an Agent allows us to analyze the chain of changes and the scope of impact more efficiently.
Once I’ve run through the simulation in my head, I list all the items to be executed in my own notepad. Then, I tell the agent to execute them one by one using vibe mode.
Where is the difference? It lies in the granularity. The items in my notepad are precise down to which file, which module, or even which function. And I tell the agent exactly where to make what kind of changes with that same precision.
Why do we need to be so precise?
Because I found that AI’s taste in code is still worse than mine. The code it writes looks incredibly ugly to me personally. It has no aesthetic sense at all. So I tell it exactly what to do and how to do it.
We’ll find that vibe coding is really just a fancier auto-completion for me. But I think that’s enough. Facts have proven that this level of efficiency boost is sufficient.
Wrap Up
Why did I make this shift in workflow?
Thinking back, the straw that broke the camel’s back was that Claude loves writing documents for absolutely everything, big or small. Every document is long and tedious. It got to the point where reading them was painful, but not reading them felt wrong too.
Instead of torturing ourselves like this, let’s just ditch these intermediate documents. For me, they have no reference value.
The motivation driving me to slowly transition to this new workflow is something I’ve mentioned before. It’s simply that the code written by AI looks too ugly. It’s full of bad smells.
Rather than dealing with that, I’d really prefer to write it myself, or make the AI write it strictly according to what I say.
Traditional silos limit the productivity gains unlocked by AI workflows
As I mentioned in my previous article, I recently made a career shift. I moved from being a pure software architect to a hands-on staff role. This means I am now deeply involved in implementation.
I made this adjustment because there were things I wanted to verify. For instance, I wanted to see how much productivity an AI-powered workflow could unlock. The results proved that the efficiency gains are significant.
This led me to think about another question.
Can traditional organizational structures still serve their purpose?
The “traditional” structures I am referring to fall into two categories:
Organizations divided by function, such as PM, ENG, QA, etc.
Organizations divided by Cross-functional teams. For example, a Scrum team has a PO, developers, and QA. This might seem new rather than traditional to some people. Nevertheless, I believe this is still a traditional setup from the era before AI entered our workflows.
I raise this question because AI empowers us to increase productivity to a dramatic extent. However, the silos created by traditional organizational structures work against this boost.
There are many reasons for these silos. We have functional silos between roles. We have cognitive silos between different feature modules. And we have responsibility silos between departments. These boundaries used to seem natural. Now, AI breaks them down easily.
Let’s look at an example. We often used domain boundaries or microservice boundaries to split organizations. When Team A’s changes touched code owned by Team B, it required a lot of communication and coordination. Even development and deployment created dependencies.
Waiting is inevitable in this process. This constitutes waste.
But if this traditional organizational structure is broken, how should we define boundaries? Or simply put, how do we clarify responsibilities?
I don’t have the answer yet. I am still looking into it.
Why I switched from architect to developer to validate Gen AI in practice
In the software development track, you have a lot of options. The main choice is between heading down the architect path or focusing on the developer track.
I chose the architect path for the last few years. My work focused on research, software architecture transformation, and pilot planning. But recently, I switched back to a developer role. I still wear the architect hat sometimes, but I spend most of my time on feature development and troubleshooting.
A lot of people have asked me why I made this switch. I wanted to use this article to talk about the reasons behind it.
If you’ve been following me, you might have noticed I started covering Gen AI topics late last year. That’s also when I began seriously studying how to use AI to boost productivity.
However, in my previous role as a pure architect, I rarely worked on production code. This meant that even though I had all these theories, I could only test their real-world effectiveness on my side projects.
This presents a problem: theory and practice start to drift apart. It’s a common dilemma for many researchers.
Therefore, switching to a more hands-on role was a better choice. This way, I can actually validate whether my methodologies work in practice.
Over the past few months of doing this, I’ve found that Gen AI really does significantly boost my productivity in many areas.
I’ll list a few of the most obvious examples.
Quickly Onboarding to Brownfield Projects
I’ve briefly explained how I do this in a previous article. It mainly involves two tools: a Coding Agent and RAG.
I’m using very general terms here because everyone’s familiar tech stack is different. For my Coding Agent, I use Copilot. Of course, you can use Claude Code, Cursor, or any other tool.
And for RAG, I use NotebookLM.
My specific process is to create a Notebook for each feature. Inside each Notebook, I put the feature’s PRD, design document, technical support KBs, and code tracing.
The technical documents are pretty straightforward. But what is code tracing?
It’s a complete report I generate using my coding agent. It includes the full e2e flow for all of the feature’s entry points, the data flow, and all related data tables. Even the e2e flow is broken down in great detail, right down to the module, class, and function level.
With this material, the Notebook RAG can quickly answer almost any basic question about the project. It can even pinpoint the code locations involved in specific problems.
As a result, I didn’t need to spend much time getting up to speed on a large, unfamiliar project before I could start contributing.
Efficient Feature Iteration
One of the most common scenarios for a developer is feature iteration.
If you think I’m going to say my coding agent lets me finish programming at lightning speed, you’re going to be disappointed.
I use AI in two ways in this scenario. First, I’ll write a very rough, quick, handwritten design document. Then, I use Gemini’s OCR capability to convert it into a fully formatted document.
Designing and developing a feature requires a lot of communication and discussion upfront. I use this method to quickly create discussion materials, meeting notes, and design docs. This really saves me a ton of time.
I can use pen and paper, which I’m most comfortable with, to turn my ideas into digital documents. This is the first major improvement.
Second, during the actual software development, I already have a complete design. This includes design patterns, API interfaces, and so on. The entire development process is broken down into small enough units. This makes it very easy for me to use AI for auto-complete.
As for why I don’t let the AI develop everything and only use it for minimal assistance, I explained that in detail in a previous article. I won’t repeat it here.
Various Daily Routines
As a software engineer, I think tedious tasks take up a big part of the day. I’ve automated a large portion of this grunt work.
Let me give a few examples. I currently work across different time zones, so someone is basically working at all hours of the day.
Waking up to hundreds of emails? My solution is not to read them. I have AI quickly categorize them. It leaves only the emails I truly need to know about and those that require action. It then provides a consolidated summary so I can see what I need to do at a glance.
What about all the recorded meetings I missed? I speed-watch them. I use AI to generate and embed captions in the video. This allows me to watch them at 2x or even 4x speed.
What about all the routine maintenance work? I use AI to generate small tools for me. I even build automated workflows to handle them. This prevents me from having to do so much manual work.
I don’t use AI in a very generic way. It can’t do everything. But it’s more than enough to solve my specific pain points.
Troubleshooting
Debugging. I believe this is the one thing all developers hate the most.
It’s the same for me. A big part of why it’s so annoying is that we have to guess based on various clues. After guessing, we still have to find evidence among those clues to prove it.
It is absolutely tedious and mundane work.
The worst part is digging for evidence in thousands, or even tens of thousands, of log lines. It’s never an easy job, especially when the logs are unstructured. Now, I’ve offloaded this painful task to AI. We used to need grep, sed, and awk to process logs just to find keywords and check a timeline.
Now, I just need to tell the AI my intent, what I’m looking for. It can take over this dirty work for me.
Once it finds the relevant logs based on my intent, the guessing starts. I figure it’s easier to have a group guess than to do it alone. So, I feed these logs to several agents and let them all guess. Then we compare their answers.
By combining all their hypotheses, I can go back and ask the AI to find evidence in that vast sea of logs.
All of this dirty work? I don’t have to do it myself anymore.
Wrap Up
What I’ve mentioned above should cover most of the different aspects a software engineer deals with.
How do you use AI to boost productivity?
I believe the answer is simple. Give it the annoying work you hate doing. Your productivity will naturally go up.
But there’s one thing to keep in mind. I’ve stressed this point repeatedly in the past: AI isn’t brilliant. It’s just a tool. We must be able to master the tool to get the job done right.
Especially, remember that AI makes mistakes in many situations. We have to review the critical parts repeatedly. For example, when I ask Gemini to turn my handwritten draft into a design document, I still need to manually fix many details. But this is still much faster than writing one from scratch.
As for how much productivity has improved with AI, I don’t have exact numbers. Software engineer time estimates are rarely accurate anyway. But my gut feeling is at least a 2x boost. What does that mean? A huge modification that used to take two months now only takes one.
AI is great for PoCs, but fails at creating maintainable software
The title might sound a bit like clickbait, but even the guy who coined the term “vibe coding,” Andrej Karpathy, just pointed out that he hand-wrote his latest project. Whatever his reasons, the bottom line is: vibe coding just wasn’t good enough.
Oct 13, 2025: Andrej Karpathy gives an update on vibe coding.
That’s barely half a year. What the hell happened?
We were just celebrating how insanely capable Claude 4.5 and GPT-5 are, and suddenly the script flips?
Honestly, I’ve also been hitting the hard limits of vibe coding myself lately.
Let me provide a real-world example.
Let’s say we have a huge project and we need to introduce a behavior change. Whether it’s for A/B testing or feature toggling, we’re essentially just wrapping the old code in an if-else block to introduce the new behavior, right?
That’s a bit abstract, so let’s look at some pseudo-code.
1 2 3 4 5 6
if is_enabled("feature A"): # new behavior / new feature something_new() else: # original codeflow something_old()
Super easy to understand, right?
Now, when this feature is big enough, these if-else blocks are going to be scattered all over the codebase. What do we think an AI Agent will do?
Yes. Exactly. It’s going to slap an if-else on every single place that needs to change. So, what happens when the feature toggle rollout is complete and it’s time to clean up the codebase?
Right again. The Agent will just go back and rip out all those if-else statements. What’s the problem with that? If that if-else is spread across 100 different files, this “housekeeping” task is now touching 100 files. Would we feel safe pushing that change to production?
The beauty of this is that after the code is refactored, the actual feature flag check is hidden inside the factory. When it’s time for cleanup, we only have to modify the factory. We don’t have to touch all the integration points.
Let’s look at a concrete example.
The Factory Pattern in Practice
Let’s say we have some business logic for getting user data. The old implementation queries the database directly. The new implementation uses a dedicated microservice. We need to migrate all the database queries to the new REST API.
1 2 3 4 5 6 7 8 9
defget_user_profile(customer_id: str, email: str): if feature_flags.is_enabled(customer_id, 'USE_NEW_USER_SERVICE_FF'): # If the flag is on, call the new API service user_data = call_new_api_service(email) else: # Otherwise, query the old database user_data = query_legacy_database(email) return user_data
If we also have functions to get group info by user_id or other queries, we can imagine this if-else getting scattered everywhere.
This is where we bring in the Factory Pattern. It has three core components: an Interface, Concrete Implementations, and a Factory.
First, we define an abstract UserProvider interface. It defines the methods that all “user data providers” must have. This way, the calling code doesn’t need to care if the data is coming from a database or an API.
1 2 3 4 5 6 7 8 9 10 11 12 13 14 15 16 17
from abc import ABC, abstractmethod from typing importOptional, Dict, List, Tuple classUserProvider(ABC): """ Abstract interface for a user data provider. Defines methods all concrete providers must implement. """ @abstractmethod defget_user_by_email(self, customer_id: str, email: str) -> Optional[Dict]: """Gets user data by Email""" pass @abstractmethod defget_user_groups(self, customer_id: str, user_id: str) -> List[str]: """Gets a list of groups for a user ID""" pass
Next, we create concrete classes for the old and new services, both of which implement the UserProvider interface.
The old database service:
1 2 3 4 5 6 7 8 9 10 11 12 13 14 15
classOldDatabaseUserProvider(UserProvider): """ Implementation for fetching user data from the legacy database. """ defget_user_by_email(self, customer_id: str, email: str) -> Optional[Dict]: print(f"--- (Legacy System) Querying DB for Email: {email} ---") # Simulate DB query... if email == "test@example.com": return {'user_id': 'db_123', 'email': email, 'name': 'DB User'} returnNone defget_user_groups(self, customer_id: str, user_id: str) -> List[str]: print(f"--- (Legacy System) Querying DB for User ID: {user_id}'s groups ---") # Simulate query... return ['group_a_db', 'group_b_db']
The new API service:
1 2 3 4 5 6 7 8 9 10 11 12 13 14 15
classNewAPIUserProvider(UserProvider): """ Implementation for fetching user data from the new microservice API. """ defget_user_by_email(self, customer_id: str, email: str) -> Optional[Dict]: print(f"--- (New System) Calling API for Email: {email} ---") # Simulate API call... if email == "test@example.com": return {'user_id': 'api_xyz', 'email': email, 'name': 'API User'} returnNone defget_user_groups(self, customer_id: str, user_id: str) -> List[str]: print(f"--- (New System) Calling API for User ID: {user_id}'s groups ---") # Simulate API call... return ['group_x_api', 'group_y_api']
Finally, we create a UserProviderFactory. Its only job is to decide which concrete UserProvider instance to return based on the given conditions (here, the customer_id and his feature flag).
1 2 3 4 5 6 7 8 9 10 11 12 13 14 15 16 17 18 19
classUserProviderFactory: def__init__(self): # Pre-build and cache the instances to avoid re-creation self._providers = { 'database': OldDatabaseUserProvider(), 'api': NewAPIUserProvider() } defget_provider(self, customer_id: str) -> UserProvider: """ Decides which provider to return based on the feature flag. This is the core of the pattern, centralizing the "decision logic". """ if feature_flags.is_enabled(customer_id, 'USE_NEW_USER_SERVICE_FF'): print("Factory Decision: Using NewAPIUserProvider") return self._providers['api'] else: print("Factory Decision: Using OldDatabaseUserProvider") return self._providers['database']
Now, we’ve completely encapsulated the object creation and selection logic within the factory.
After implementing the factory, the business logic function that was full of if-else statements becomes way simpler.
The client code no longer needs to care about “which service to use” or “how to build the service object.” It just asks the factory for a usable UserProvider.
In the future, when it’s time to clean up, we only need to touch the feature_flags.is_enabled line in the factory and delete the legacy OldDatabaseUserProvider. This ensures all client code is unaffected and dramatically shrinks the cleanup’s blast radius.
Here’s Another Thing the Agent Won’t Tell Us
Let’s do one more example.
Today’s AI agents are smart. They even write tests for their code. But if we actually look at the tests they write, we’ll find they are full of duplicated code, especially when they’re trying to cover a bunch of corner cases.
These kinds of unit tests are basically unmaintainable. A future logic change could instantly break a ton of test cases.
What’s the right way to do it? As I’ve explained in a previous article, we need to use table-driven testing to consolidate all the test cases.
A unit test follows the Arrange-Act-Assert (AAA) pattern. For different test cases, the only parts that really change are ‘Arrange’ (the inputs) and ‘Assert’ (the expected outputs). So, we can just build a table (an array) of all the cases and run them all through a single loop.
In fact, a lot of testing frameworks have-built in support for this. For example, pytest does this with mark.parametrize.
1 2 3 4 5 6 7 8 9 10 11 12 13
import pytest @pytest.mark.parametrize("expression,expected", [ ("2 + 3", 5), ("2 + 3 * 4", 14), ("(2 + 3) * 4", 20), # and so on ] ) deftest_calculator(expression, expected): ret = calculator(expression) assert ret == expected
The agent won’t tell us any of this.
Not unless we explicitly tell it: “I want us to implement the Factory Pattern” or “I want us to use table-driven testing.”
And this is the limit of vibe coding. I’ve spent a lot of time in the past discussing the practical details of vibe coding, and I was an early adopter of spec-driven development workflows.
But when I seriously review the AI’s output, I find that even with something as powerful as Claude 4.5, the code it produces is still full of redundancy. This redundant code might be correct, and it might even work, but over time, it will become completely unmaintainable.
Both humans and AI have a limited context window.
Ultimately, software development still comes back to good software engineering practices.
We need to discuss design patterns. We need to consider feature onboarding and all the other real-world architecture problems. Vibe coding is great for building a PoC (Proof of Concept) really fast. But a PoC is not an MVP. The moment we need to turn that PoC into a real product, we still have to rely on the experience and wisdom of a human software engineer to solve those real-world problems.
Wrap Up
We used two concrete examples to explain the limits of vibe coding: one with design patterns and one with table-driven testing.
We might be thinking, “Well, can’t we just define all these rules in the system instructions?” That’s… yes and no.
There are so many design patterns. If we don’t specify which one, can the AI really pick the right one? What we call “design patterns” are split into three major categories — Creational, Structural, and Behavioral — each with dozens of different patterns.
Remember, the AI has a limited context. In a massive codebase, it needs to identify the problem, break it down, and propose the right solution. I don’t need to tell us how hard that is.
And that’s just talking about the narrow definition of design patterns. That’s not even getting into Pattern-Oriented Software Architecture or all the higher-level architectural problems like microservices, event-driven architecture, etc.
These are not problems an AI can solve just by glancing at a codebase or reading a detailed spec.
Don’t get me wrong, I’m still going to use vibe coding. But for me, its value right now has been reduced to just a super-powered auto-complete.
To put it bluntly, the auto-complete that AI gives me is just a lot more flexible than the old-school, rule-based completion. But at the end of the day, that’s all it is.
A message from our Founder
Hey,Sunilhere. I wanted to take a moment to thank you for reading until the end and for being a part of this community.
Did you know that our team run these publications as a volunteer effort to over 3.5m monthly readers? We don’t receive any funding, we do this to support the community. ❤️
Enhance lightweight DAG with robust features for production-ready workflows
The previous article stopped at building a lightweight DAG with the Command pattern. That alone already made long functions more approachable and easier to test. Over the past week I kept iterating on the idea, because real systems rarely end with a single happy-path runner.
Three concerns show up almost immediately in production code: transient failures, partial completion, and throughput. They translate nicely into three extensions on top of the original runner: retry, rollback, and parallel execution.
Before diving into the new capabilities, here is the baseline runner from last week that simply walks the graph in topological order:
1
2
3
4
5
6
7
8
9
10
11
12
13
from graphlib import TopologicalSorter classDAGRunner: def__init__(self, graph_definition: dict, commands: dict): self.ts = TopologicalSorter(graph_definition) self.commands = commands defrun(self): context = {} self.ts.prepare() for task_name in self.ts.static_order(): self.commands[task_name].execute(context) return context
This runner is the foundation for every extension in this article.
What matters here is that all three enhancements live inside the runner. The commands stay thin, the workflow definition stays declarative, and the abstraction keeps paying off. Let’s walk through each scenario.
Handling retries without polluting business logic
External integrations fail from time to time. The naive solution is to wrap every command in its own retry loop, but that instantly clutters the code we just spent effort to clean up. Moving retries into the runner keeps the commands focused while letting us tune policies centrally.
import time from graphlib import TopologicalSorter classDAGRunnerWithRetry: def__init__(self, graph_definition: dict, commands: dict, *, max_retries: int = 3, retry_delay: float = 1.0): self.ts = TopologicalSorter(graph_definition) self.commands = commands self.max_retries = max_retries self.retry_delay = retry_delay defrun(self): context = {} self.ts.prepare() for task_name in self.ts.static_order(): command = self.commands[task_name] last_error = None for attempt inrange(1, self.max_retries + 1): try: command.execute(context) last_error = None break except Exception as exc: last_error = exc if attempt < self.max_retries: time.sleep(self.retry_delay) if last_error isnotNone: raise last_error return context
The graph still decides the order, while the runner handles the repeated attempts. Any transient exception is retried in place; once the configured attempts are exhausted, the original error propagates.
Rolling back after a failed step
The next requirement is undoing work if a later step fails. The Command pattern already hinted at this with its symmetric interface, so introducing undo is a natural extension. The runner simply needs to record the successful commands and process them in reverse when an error bubbles up.
from graphlib import TopologicalSorter classDAGRunnerWithRollback: def__init__(self, graph_definition: dict, commands: dict): self.ts = TopologicalSorter(graph_definition) self.commands = commands defrun(self): context = {} successful_commands = [] try: self.ts.prepare() for task_name in self.ts.static_order(): command = self.commands[task_name] command.execute(context) successful_commands.append(command) except Exception as exc: for command inreversed(successful_commands): command.undo(context) raise exc return context
Each command now implements both execute and undo. When a later task fails, the runner cleans up previously completed work in last-in-first-out order, mirroring the graph execution.
Unlocking parallel branches
Many workflows contain independent branches that can safely run side by side once their prerequisites finish. The original runner executes nodes sequentially even when the graph exposes available concurrency. Switching to a thread pool allows the runner to schedule every ready node without rewriting the business logic.
from concurrent.futures import ThreadPoolExecutor, as_completed from graphlib import TopologicalSorter classDAGRunnerWithParallel: def__init__(self, graph_definition: dict, commands: dict): self.ts = TopologicalSorter(graph_definition) self.commands = commands defrun(self): context = {} self.ts.prepare() with ThreadPoolExecutor() as executor: futures = {} while self.ts.is_active(): for task_name in self.ts.get_ready(): command = self.commands[task_name] futures[executor.submit(command.execute, context)] = task_name for future in as_completed(list(futures)): task_name = futures.pop(future) try: future.result() self.ts.done(task_name) except Exception: for pending in futures: pending.cancel() raise return context
The runner keeps asking the topological sorter for ready nodes, submits them to the executor, and marks each task as complete once the future finishes. If any parallel branch fails, the remaining futures are cancelled and the error is surfaced immediately.
Wrap Up
All three extensions reuse the same two abstractions introduced earlier: the DAG encodes dependency, and Command encapsulates each operation behind a stable interface. Because the runner owns orchestration, we can iteratively add capabilities such as retry strategies, rollback semantics, and parallel scheduling without rewriting domain logic.
That’s the real payoff of the abstraction. Once the seams are in place, new requirements stay localized, the codebase remains comprehensible, and future experiments can continue to build on the same foundation.
A message from our Founder
Hey,Sunilhere. I wanted to take a moment to thank you for reading until the end and for being a part of this community.
Did you know that our team run these publications as a volunteer effort to over 3.5m monthly readers? We don’t receive any funding, we do this to support the community. ❤️
Tame complex workflows and simplify testing with the Command design pattern
Reviewing some legacy code lately has given me a headache.
The main issue is one massive function crammed with every piece of logic spread out flat inside it. I have to say, this is what I consider the worst kind of “code smell.”
You might ask, “But this function works fine, so what’s wrong with it?”
If it were a static function with no further iterations needed, that’d be fine. But if this function still requires iterations, or worse, isn’t even stable yet with a bunch of process bugs still needing fixing, then it’s absolutely terrible.
Modifying the flow of a massive function is challenging, whether adding conditional checks or introducing new steps. First, developers must understand every existing process to grasp the context and make changes.
After spending tremendous effort to understand the function and complete the modification, the next problem is how to test it.
If it’s a massive function, I believe its unit tests are likely filled with various mocks. Once part of the logic is modified, the worst-case is that all unit tests fail. Moreover, these failures aren’t due to test scenario issues, but simply because the mocks no longer work.
The book Refactoring also ranks Long Methods very high among code smells.
To sum up, a massive function causes numerous problems. So, are there any effective approaches to mitigate this?
Abstraction
Software development is essentially a series of abstraction processes.
Therefore, the most common approach to solving the Long Method problem is to encapsulate each process node into a sub-method. Through effective naming of these sub-methods, we can more easily understand the original complete workflow.
Each sub-method also facilitates unit testing. By ensuring each sub-method functions correctly, the overall behavior remains correct as long as the flow is accurate.
Abstracting a massive function resolves the first issue: maintainability. New team members can grasp the flow faster and continue development.
However, sub-methods alone cannot solve every problem.
For example, in the following example we break down a complex handle_order into a clear, step-by-step process, making it easy for anyone taking over to understand it.
1 2 3 4 5 6 7 8 9
defhandle_order(order_data): ok = validateOrder(order_data) ifnot ok: raise ValidateException() ok = processPayment(order_data) ifnot ok: raise ProcessException() ok = sendNotification(order_data) ifnot ok: raise NotificationException()
Now, we want to add a new process, which is when the order amount exceeds 1000, we need to incorporate an approval step.
1
2
3
4
5
6
7
8
9
10
11
12
13
defhandle_order(order_data): ok = validateOrder(order_data) ifnot ok: raise ValidateException() ok = processPayment(order_data) ifnot ok: raise ProcessException() if order_data['amount'] > 1000: ok = approval(order_data) ifnot ok: raise ApprovalException() ok = sendNotification(order_data) ifnot ok: raise NotificationException()
Looks fine, right?
My first thought is it looks a bit tricky to write tests for.
Let’s write a classic Python test case to demonstrate the underlying logic behind testing.
An overwhelming number of mocks, making them extremely difficult to manage
The use of assert_called_once to validate logic feels counterintuitive
When if-else conditions multiply, such test cases become highly confusing.
Therefore, simply extracting sub-methods is insufficient for achieving a high level of abstraction.
Where’s the problem?
I believe most software development or refactoring actually stops at the previous step. Then layers upon layers get stacked between sub-methods, and eventually spaghetti code emerges.
Because we haven’t achieved true abstraction.
The purpose of abstraction is not to be vague, but to create a new semantic level in which one can be absolutely precise. — Edsger Dijkstra
We only handled the syntax but not the semantics.
If it were me, I would do it this way.
First, we abstract these tasks to be executed into individual tasks.
So we would have an abstract list (A, B, C, D), which is the ultimate expression of abstraction.
We’ve transformed the entire handle order process into the following two types.
A -> B -> D
A -> B -> C -> D
This essentially forms a directed acyclic graph (DAG).
Consequently, our subsequent tasks involve DAG operations, where any workflow modification simply adds a node or an edge. Our validation no longer needs to focus on what each node does; we only need to verify that the DAG matches our expectations.
In other words, we are comparing whether assert(workflow == “A -> B -> C -> D”) holds true under specific conditions.
Command Design Pattern
We have now abstracted the process into a DAG, but this is still insufficient.
For each node, its interface is not standardized, so we cannot treat all nodes equally. Therefore, we need to introduce a common interface for these nodes. In design patterns, there is one that fits this scenario perfectly, called Command.
Since these nodes are essentially operations, using Command also satisfies the semantic requirements.
We consolidated all logic under a single class, OrderProcessingReceiver, to prevent workflow logic from being scattered across multiple locations.
Next, we defined the standard Command interface method execute. With this Command, we can create the operation classes for the four nodes on the DAG, which will later be converted into nodes A, B, C, and D.
DAG Builder
Once we have our operations, we proceed to create the DAG.
First, we need methods to create nodes and edges. In fact, Python 3.9 and later includes a built-in library graphlib that already handles this. We don’t need to reinvent the wheel ourselves.
However, the data structures used by graphlib are a bit ugly, and I’m not particularly comfortable with them.
The DAG generated by the graph above would be A -> B -> C -> D. However, you may notice that this definition reverses the order of the DAG, which I personally find counterintuitive. Therefore, I referenced Airflow’s notation and made some modifications.
classDAGBuilder: def__init__(self): self.graph, self._nodes = {}, {} deftask(self, name): if name notin self._nodes: self.graph.setdefault(name, set()) self._nodes[name] = self._Node(self, name) return self._nodes[name] defbuild(self): return self.graph class_Node: def__init__(self, builder, name): self.builder, self.name = builder, name def__rshift__(self, other): self.builder.graph[other.name].add(self.name) return other
Within the node, I overrode __rshift__. This is purely to make the edges in the entire DAG resemble Airflow’s style. Using it is essentially syntactic sugar.
By combining our original example with this DAGBuilder, we can now implement a workflow that generates a DAG.
At this point, we can abstract the entire process into a unified notation. But we need to execute this workflow, right?
So let’s continue.
DAG Runner
We have previously performed numerous abstractions.
Abstracting the workflow into a DAG
Abstracting operations into Commands
Now, we will combine these two to transform this DAG into an executable sequence of Commands.
1 2 3 4 5 6 7 8 9 10 11 12 13
from graphlib import TopologicalSorter classDAGRunner: def__init__(self, graph_definition, commands): self.ts = TopologicalSorter(graph_definition) self.commands = commands defrun(self): context = {} self.ts.prepare() for task_name in self.ts.static_order(): self.commands[task_name].execute(context) return context
This runner doesn’t do anything special. It simply takes the DAG we just generated and our defined commands, feeds them in, and executes them in order using the TopologicalSorter.
The TopologicalSorter correctly extracts the node that should be executed at any given moment based on the DAG’s content, then finds the corresponding operation in the command list and executes it.
Finally, let’s see what handle_order will look like.
From the final handle_order method, we can see that when abstraction is taken to its extreme, the main program contains no “impurities.” All workflow logic is defined in create_workflow_blueprint, while all operations reside in OrderProcessingReceiver.
When writing tests, unit tests only need to focus on the internal implementation of each Command, ensuring each Command is correct. Integration tests become even simpler, requiring only verification that create_workflow_blueprint produces the expected DAG.
Compared to our initial test full of mock objects, this test is straightforward and easy to understand, and it’s also easier to maintain. That’s the power of abstraction.
Besides making the process easier to understand and tests easier to write, what other benefits does this kind of abstraction offer?
Of course it does, and plenty of them.
When we abstract each operation, all operations become equivalent to the DAGRunner. This allows us to add more functionality to the DAGRunner. For example, we can make each operation retry-capable. Without this abstraction layer, adding retry functionality would require modifying every sub-method individually.
Moreover, we can even implement rollback using the Command pattern. If you’re familiar with the Command pattern, you’ll notice that besides the required execute interface, we can also introduce a redo method. This allows DAGRunner to perform a sequential rollback after a Command fails.
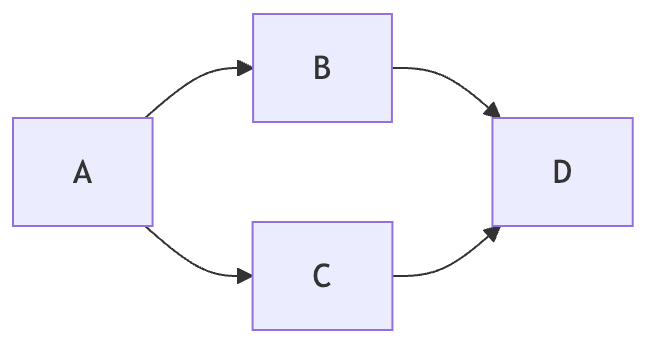
Furthermore, we can introduce additional parallel processing. Let’s use the following DAG as an example.
After task A completes, tasks B and C can run concurrently until both finish, at which point task D is processed. This mechanism can also be implemented within DAGRunner.
Since today’s article is already quite large, I can save these follow-up points for the next article if needed.
Let’s call it a day.
A message from our Founder
Hey,Sunilhere. I wanted to take a moment to thank you for reading until the end and for being a part of this community.
Did you know that our team run these publications as a volunteer effort to over 3.5m monthly readers? We don’t receive any funding, we do this to support the community. ❤️
Use DNS spoofing to create mock services for easier local integration tests
When developing and testing microservices, we often encounter a common challenge, that is, the functionality of microservices heavily relies on external services. This makes it difficult to conduct functional testing in a closed environment or even a local environment.
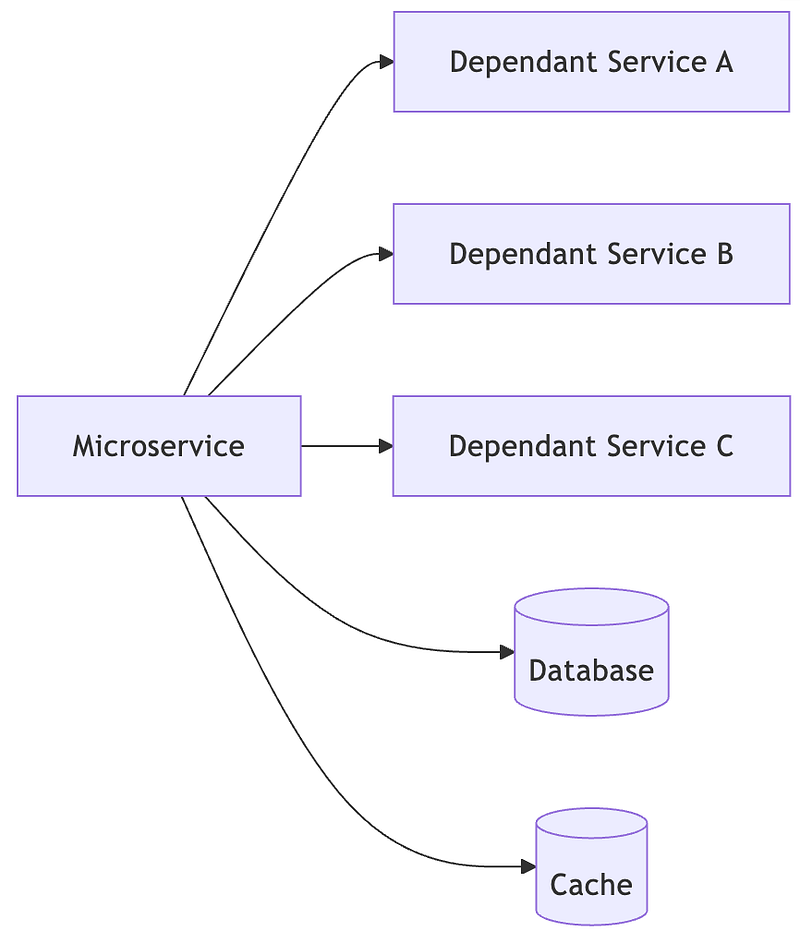
Here is a classic example.
This microservice has numerous dependencies, some being internal databases and others external web services. When doing integration testing, especially when running locally, we encounter a serious problem, most tests either fail or become difficult to execute.
There are several common challenging scenarios.
HTTP requests time out because the external service is unavailable, causing subsequent calls to fail.
HTTP requests are processed correctly without timeouts, but return unexpected results, such as a 404 Not Found error.
HTTP requests are received by the corresponding service but cause side effects.
This scenario makes development and testing extremely difficult. Without a real environment to validate the correctness of our own services, the entire correctness is constrained by those external dependencies.
Is there a solution?
Well, we can use DNS Hijack.
DNS Hijack
DNS Hijack is a common cyberattack that redirects our network connections to unexpected destinations, potentially causing harm.
The most classic example occurs when using public Wi-Fi, where the DNS server is hijacked to a malicious DNS. When you visit specific websites, your connection is redirected to phishing sites. This leads you to unknowingly enter your credentials, resulting in credential leakage.
However, DNS Hijack can also be a highly useful tool, particularly during integration testing in development environments, where it significantly boosts development and testing efficiency.
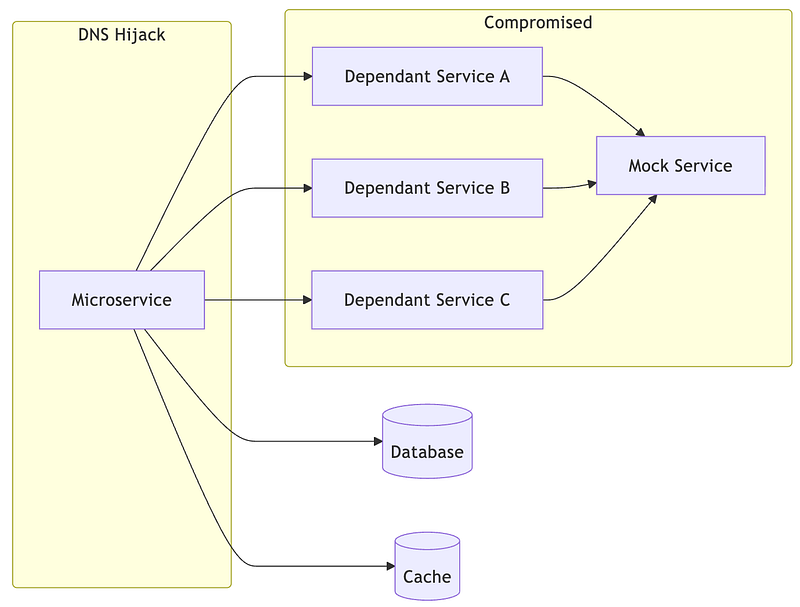
Let’s continue using the example above to illustrate.
For the microservices we’re developing, it remains completely unaware. Everything proceeds as usual, continuing to request services A, B, and C. However, these services have actually been hijacked and redirected to a mock service.
This mock service is highly customizable, capable of consistently returning a 200 OK status or even generating different responses based on the service path and payload.
As a result, microservices can complete various integration tests without being interfered with or even noticing any changes.
How-to
To implement this functionality, two core components are required. One is a DNS server capable of performing spoofing, and the other is a mock service that can handle various requests.
I am not teaching you how to perform DNS hijacking. Please exercise caution when deciding where to use this.
The final solution is available in this GitHub Repo.
The app plays the role of the original service. It demonstrates a non-intrusive implementation, so the app can be replaced with any service.
dns-proxy is the project’s core component. It redirects all “unknown” hosts to mock-server. The emphasis on “unknown” is crucial because, in microservice integration testing scenarios, we still need microservices to correctly access databases and other essential dependencies.
mock-server is another core component. It responds with a 200 OK to “any” HTTP request. The emphasis on “any” means it can handle requests regardless of the port.
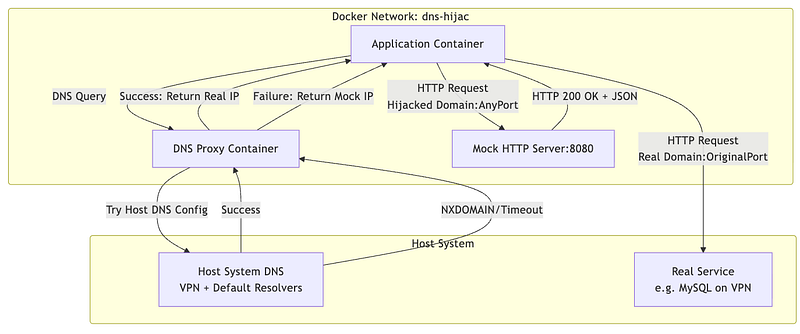
The entire process is straightforward. The app first sends a hostname query to the DNS proxy to obtain the IP address. Since this is merely a proxy, the DNS proxy then queries the actual DNS server for the IP.
If the DNS server recognizes the hostname, it returns the real IP address; otherwise, the query fails. When the DNS proxy fails to obtain the IP, it returns the IP address of the mock server to the app.
Although it’s non-intrusive for the app, we did make a minor modification to it. However, this change is at the infrastructure layer, not at the code level.
The key to achieving DNS hijacking lies in manually specifying the app’s DNS server and configuring it as a DNS proxy. Details can be found in the docker-compose.yml file.
1 2 3 4 5 6 7 8
app: image:nginx:alpine# Placeholder - will be replaced with actual application image container_name:dns-hijack-app networks: dns-hijack-net: ipv4_address:172.19.0.10 dns: -172.19.0.20# Use DNS proxy as primary DNS server
When using public Wi-Fi, this DNS server is assigned by the DHCP server, which is precisely why public Wi-Fi poses such risks.
The process above details how a DNS proxy operates. Now let’s examine the mock server.
The mock server functions relatively simply, it’s essentially a basic HTTP server that always returns a 200 OK response. Despite this, its core functionality lies in the startup script. Within this script, we use a series of iptablesnat rules to redirect any destination port to port 8080, which the mock server is listening on.
This enables the mock server to handle any destination. In other words, when the application initiates requests to external services, whether abc.test:1234 or def.svc:5678, they ultimately reach port 8080 on the mock server.
Integration Details
Since we’re using a DNS proxy without overriding the original DNS server, the network access that was originally available to the app remains completely unaffected.
I tested numerous target combinations in my end-to-end tests, including hosts within the VPN (internal-db.company.example). If you run the e2e tests directly, they will likely fail. The primary reason is that if your network segment cannot access internal-db.company.example, requests will be redirected to the mock server, which is inconsistent with my test assertions.
Therefore, you can modify the e2e validation conditions to better align with your use case.
Additionally, while I mentioned in README.md that swapping the app image allows testing any service, sometimes we already have a complex Docker Compose script where such changes are difficult. That’s okay, as there’s an even simpler approach.
Simply add include to the original microservice’s test script and manually configure dns and networks.
If the service was originally running on a VM or physical machine, it’s straightforward, just edit /etc/resolv.conf. Essentially, you need to specify the DNS server to point to the DNS proxy.
Wrap Up
Although this article explains DNS Hijack, our use case is development and testing within our local environment. Within our controllable scope, redirecting DNS to our required mock server is the fastest and most effective approach.
In this project, it’s evident that the mock server I’m using currently has minimal functionality. It simply responds with a 200 OK to all requests. However, we can expand the mock server’s capabilities to better suit integration testing scenarios.
For example, when the app expects /v1/user/info to return JSON data containing a test user, we can configure the mock server to customize responses based on this path. This depends entirely on what we aim to validate in integration testing and which workflows we wish to replicate.
Any cyberattack is essentially a double-edged sword. On one hand, we need to understand its underlying principles to avoid being compromised. On the other hand, we can leverage its mechanisms to achieve remarkable results.
I hope this project brings some fresh insights.
A message from our Founder
Hey,Sunilhere. I wanted to take a moment to thank you for reading until the end and for being a part of this community.
Did you know that our team run these publications as a volunteer effort to over 3.5m monthly readers? We don’t receive any funding, we do this to support the community. ❤️