Solving Gevent Pool Issues in Flask Apps
Solving Gevent Pool Issues in Flask Apps
Learn how Keep-Alive connections can drain your Gevent pool and crash pods

Recently, we have been troubleshooting a stubborn issue. Pods kept restarting for no apparent reason. The cause was liveness and readiness probe failures.
This sounds common, right? But here is the catch. We had already tuned our liveness and readiness probes to be as simple as possible. Like this:
1 |
|
It always returns HTTP 200 OK. Yes, always.
Even with this setup, we still saw liveness and readiness failures.
Before we dig into the problem, let’s look at the microservice’s infrastructure. First, it is a Flask application. However, we aren’t using Gunicorn for concurrency. We are using Gevent.
This means each pod is effectively a single-process Flask app. It uses coroutines, or “greenlets,” to handle each request. Now that we understand the setup, let’s analyze the root cause layer by layer.
Question 1: Why does such a simple health check fail?
Logically, a “Hello World” response shouldn’t trigger errors or timeouts. So why did the health check fail?
We have to look at the design. To prevent resource exhaustion, we configured a Gevent pool. Whenever a request comes in, we grab a greenlet from the pool to handle it. If the pool is empty, we can’t handle any requests. Not even the simple ones.
Take a look at the graph below.
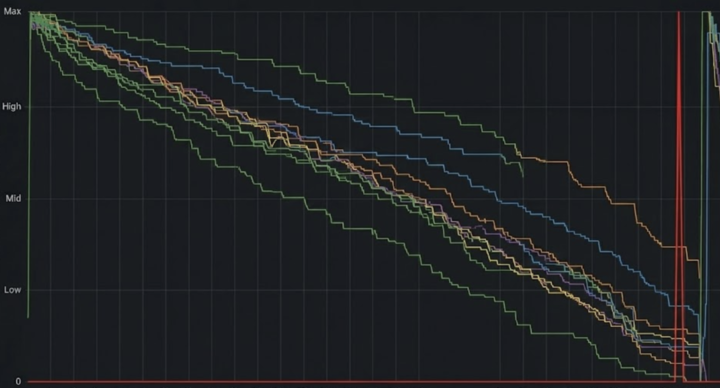
The red line shows the number of pod restarts. The other lines show the remaining capacity of the Gevent pool, which keeps dropping. When the pool hits zero, the app can’t respond to health checks. This triggers a pod restart.
After the restart, the Gevent pool in the new pod becomes available again, and it can resume service.
Question 2: Why does the Gevent pool run out?
We know the immediate cause. Now we need to find out what is consuming the Gevent pool. We need to understand why we ran out of greenlets.
At first, we suspected high CPU usage. If the CPU spikes, every request takes longer to respond. This would mean each greenlet is occupied for more time.
Eventually, this creates a slow leak.
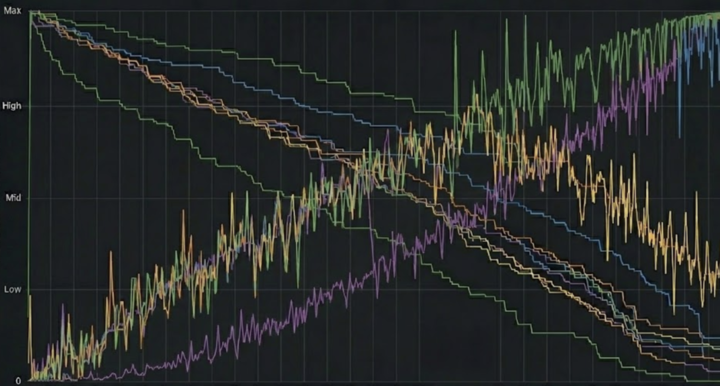
The overlay of the Gevent pool and CPU usage seemed to support this theory.
However, further analysis proved us wrong. Even when the CPU spiked, the peak usage never hit the full CPU request limit for the pod. We also didn’t see any signs of CPU throttling. So, this hypothesis didn’t hold up.
Question 3: Is it a Gevent leak?
To figure out what is holding onto the greenlets, we need to dump the current greenlet stack. Fortunately, Gevent provides a tool for this: gevent.utils.print_run_info.
We used this to analyze the dump and see what each greenlet was doing. We found a huge number of greenlets waiting on read_requestline.
Below is a breakdown of the code flow.
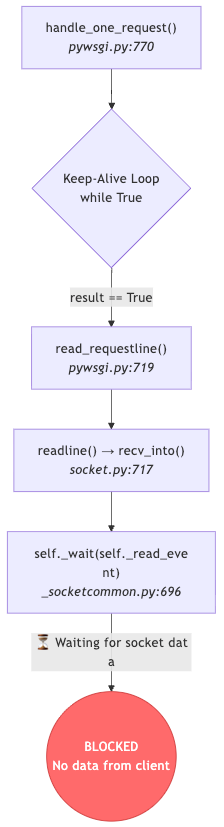
This is typical HTTP Keep-Alive behavior. If a client keeps the connection open but doesn’t send a request, the greenlet waits indefinitely.
Now we have our answer. The greenlets were being forced to stay alive because of the Keep-Alive setting. This eventually drained the Gevent pool.
Question 4: Who is hogging the connections?
We have another way to prove that Keep-Alive is the culprit. We can use netstat to check the status of the TCP connections.
First, let’s verify if there really are persistent TCP connections.
1 | $ netstat -tn | grep ':8080' | awk '{print $6}' | sort | uniq -c |
The results show 234 established connections.
But who established them? We can use netstat again to find out.
1 | $ netstat -tn | grep ESTABLISHED | awk '{print $5}' | cut -d: -f1 | sort -u |
Now we know the source IPs. We can analyze who these sources are and figure out how to handle them.
Wrap Up
In fact, there are more questions to answer:
- Question 5: Who exactly is the source?
- Question 6: Why do they open connections but not close them?
However, these answers depend on the specific infrastructure environment. I won’t go deeper into those details in this article.
Still, this Root Cause Analysis process should apply to almost any web service. It is especially useful for Python services. By following the flow in this article, we don’t have to blindly suspect CPU or memory issues every time something goes wrong. We have the tools and methods to track down deeper problems.
Let’s call it a day.
Originally published on Medium